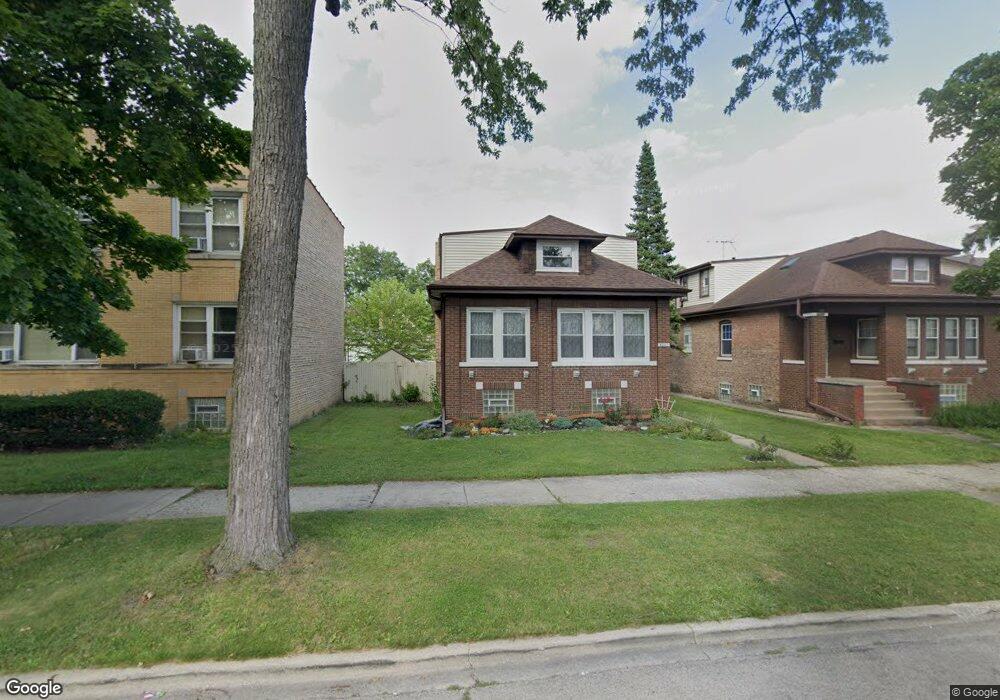
5263 N Lind Ave Chicago, IL 60630
Jefferson Park NeighborhoodEstimated Value: $490,000 - $623,000
6
Beds
3
Baths
1,800
Sq Ft
$300/Sq Ft
Est. Value
About This Home
This home is located at 5263 N Lind Ave, Chicago, IL 60630 and is currently estimated at $540,430, approximately $300 per square foot. 5263 N Lind Ave is a home located in Cook County with nearby schools including Farnsworth Elementary School, Taft High School, and St. Constance School.
Ownership History
Date
Name
Owned For
Owner Type
Purchase Details
Closed on
Apr 10, 2017
Sold by
Phoenix Management Services Inc
Bought by
Niemczyk Elizabeth E and Mueller Brian M
Current Estimated Value
Home Financials for this Owner
Home Financials are based on the most recent Mortgage that was taken out on this home.
Original Mortgage
$280,000
Outstanding Balance
$141,053
Interest Rate
3.5%
Mortgage Type
New Conventional
Estimated Equity
$399,377
Purchase Details
Closed on
Apr 13, 2016
Sold by
Lewandowski
Bought by
Phoenix Management Services
Purchase Details
Closed on
Mar 21, 2005
Sold by
Jilek Bonnie
Bought by
Lewandowski Bogan
Home Financials for this Owner
Home Financials are based on the most recent Mortgage that was taken out on this home.
Original Mortgage
$276,000
Interest Rate
4.87%
Mortgage Type
Unknown
Purchase Details
Closed on
Nov 20, 2002
Sold by
Jilek Bonnie and Tepsick Sandra
Bought by
Jilek Bonnie and Stewart Family Trust
Purchase Details
Closed on
Sep 23, 1996
Sold by
Paralez Cynthia L and Stewart Cynthia L
Bought by
Stewart Dolores S
Create a Home Valuation Report for This Property
The Home Valuation Report is an in-depth analysis detailing your home's value as well as a comparison with similar homes in the area
Home Values in the Area
Average Home Value in this Area
Purchase History
| Date | Buyer | Sale Price | Title Company |
|---|---|---|---|
| Niemczyk Elizabeth E | $380,000 | None Available | |
| Phoenix Management Services | $235,000 | None Available | |
| Lewandowski Bogan | $345,000 | Heritage Title Company | |
| Jilek Bonnie | -- | Pntn | |
| Stewart Dolores S | -- | Lawyers Title Insurance Corp |
Source: Public Records
Mortgage History
| Date | Status | Borrower | Loan Amount |
|---|---|---|---|
| Open | Niemczyk Elizabeth E | $280,000 | |
| Previous Owner | Lewandowski Bogan | $276,000 |
Source: Public Records
Tax History Compared to Growth
Tax History
| Year | Tax Paid | Tax Assessment Tax Assessment Total Assessment is a certain percentage of the fair market value that is determined by local assessors to be the total taxable value of land and additions on the property. | Land | Improvement |
|---|---|---|---|---|
| 2024 | $7,178 | $36,000 | $15,625 | $20,375 |
| 2023 | $6,997 | $34,000 | $12,500 | $21,500 |
| 2022 | $6,997 | $34,000 | $12,500 | $21,500 |
| 2021 | $6,841 | $34,000 | $12,500 | $21,500 |
| 2020 | $6,368 | $28,571 | $8,437 | $20,134 |
| 2019 | $6,382 | $31,746 | $8,437 | $23,309 |
| 2018 | $6,275 | $31,746 | $8,437 | $23,309 |
| 2017 | $5,800 | $26,927 | $7,500 | $19,427 |
| 2016 | $5,396 | $26,927 | $7,500 | $19,427 |
| 2015 | $4,937 | $26,927 | $7,500 | $19,427 |
| 2014 | $4,789 | $25,792 | $6,875 | $18,917 |
| 2013 | $4,694 | $25,792 | $6,875 | $18,917 |
Source: Public Records
Map
Nearby Homes
- 5218 N Liano Ave
- 5351 W Foster Ave
- 5252 N Leamington Ave
- 5342 W Winnemac Ave
- 5151 W Winona St
- 4956 N Lockwood Ave Unit 1
- 4946 N Lockwood Ave Unit 1N
- 4976 N Milwaukee Ave Unit 101
- 5233 W Olive Ave
- 5641 W Carmen Ave
- 4926 N Lester Ave Unit 49261W
- 5019 W Carmen Ave
- 5352 N Magnet Ave
- 5134 W Strong St
- 5523 N Major Ave
- 5626 N Central Ave
- 4923 W Winona St
- 4915 N Central Ave Unit 16-3E
- 5000 W Argyle St
- 5657 N Parkside Ave
- 5267 N Lind Ave
- 5267 N Lind Ave Unit 2
- 5259 N Lind Ave
- 5313 N Lieb Ave Unit 2S
- 5257 N Lind Ave
- 5253 N Lind Ave
- 5270 N Liano Ave
- 5272 N Liano Ave
- 5266 N Liano Ave
- 5276 N Liano Ave
- 5249 N Lind Ave
- 5262 N Liano Ave
- 5245 N Lind Ave
- 5258 N Liano Ave
- 5260 N Lind Ave
- 5266 N Lind Ave
- 5256 N Lind Ave
- 5270 N Lind Ave
- 5312 N Lieb Ave
- 5254 N Liano Ave