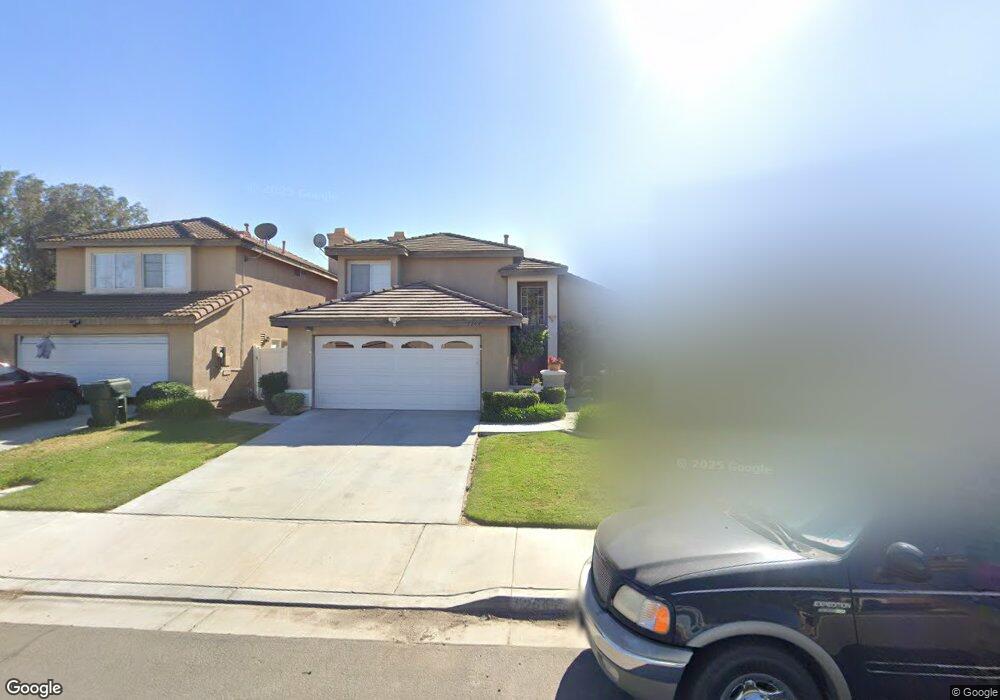
5264 Wenatchee Way Riverside, CA 92509
Rubidoux NeighborhoodEstimated Value: $648,000 - $687,605
4
Beds
3
Baths
1,831
Sq Ft
$361/Sq Ft
Est. Value
About This Home
This home is located at 5264 Wenatchee Way, Riverside, CA 92509 and is currently estimated at $661,401, approximately $361 per square foot. 5264 Wenatchee Way is a home located in Riverside County with nearby schools including Peralta Elementary, Mission Middle School, and Rubidoux High School.
Ownership History
Date
Name
Owned For
Owner Type
Purchase Details
Closed on
Oct 6, 2022
Sold by
Bryson Richard Don
Bought by
Bryson Richard Don and Tafoya-Bryson Patricia
Current Estimated Value
Home Financials for this Owner
Home Financials are based on the most recent Mortgage that was taken out on this home.
Original Mortgage
$150,000
Outstanding Balance
$144,778
Interest Rate
6.66%
Estimated Equity
$516,623
Purchase Details
Closed on
Apr 18, 2021
Sold by
Bryson Dixie Ann
Bought by
Bryson Richard Don
Purchase Details
Closed on
Sep 13, 2002
Sold by
Osborne Development Corp
Bought by
Bryson Donnie Lee and Bryson Dixie Ann
Purchase Details
Closed on
Jul 26, 2001
Sold by
Loring Ranch Llc
Bought by
Osborne Development Corp
Purchase Details
Closed on
Jul 20, 2001
Sold by
Loring Ranch Llc
Bought by
Osborne Development Corp
Create a Home Valuation Report for This Property
The Home Valuation Report is an in-depth analysis detailing your home's value as well as a comparison with similar homes in the area
Home Values in the Area
Average Home Value in this Area
Purchase History
| Date | Buyer | Sale Price | Title Company |
|---|---|---|---|
| Bryson Richard Don | -- | -- | |
| Bryson Richard Don | -- | None Available | |
| Bryson Donnie Lee | $192,000 | Fidelity National Title Co | |
| Osborne Development Corp | -- | Chicago Title Co | |
| Osborne Development Corp | -- | Chicago Title Co |
Source: Public Records
Mortgage History
| Date | Status | Borrower | Loan Amount |
|---|---|---|---|
| Open | Bryson Richard Don | $150,000 |
Source: Public Records
Tax History
| Year | Tax Paid | Tax Assessment Tax Assessment Total Assessment is a certain percentage of the fair market value that is determined by local assessors to be the total taxable value of land and additions on the property. | Land | Improvement |
|---|---|---|---|---|
| 2025 | $5,876 | $552,040 | $138,010 | $414,030 |
| 2023 | $5,876 | $530,604 | $132,651 | $397,953 |
| 2022 | $5,758 | $520,200 | $130,050 | $390,150 |
| 2021 | $2,891 | $256,874 | $60,196 | $196,678 |
| 2020 | $2,862 | $254,241 | $59,579 | $194,662 |
| 2019 | $2,803 | $249,257 | $58,411 | $190,846 |
| 2018 | $2,712 | $244,370 | $57,267 | $187,103 |
| 2017 | $2,682 | $239,580 | $56,145 | $183,435 |
| 2016 | $2,644 | $234,884 | $55,045 | $179,839 |
| 2015 | $3,045 | $231,358 | $54,219 | $177,139 |
| 2014 | $2,999 | $226,828 | $53,158 | $173,670 |
Source: Public Records
Map
Nearby Homes
- 4321 Tewa Way
- 5244 Holstein Way
- 5191 Westerfield St
- 3825 Crestmore Rd Unit 494
- 3825 Crestmore Rd Unit 378
- 3825 Crestmore Rd Unit 480
- 5442 Mission Blvd
- 3726 Arora St
- 4816 Gregory Rd
- 0 Odell St
- 3747 Mintern St
- 5748 Tilton Ave
- 5754 Tilton Ave
- 4687 Knickerbocker Ln
- 0 42nd St
- 0 Mission Blvd Unit IG25268475
- 0 Mission Blvd Unit PW25275749
- 0 Mission Blvd Unit IV23139894
- 5970 Sky Meadow St
- 3634 Pioneer Dr
- 5258 Wenatchee Way
- 5270 Wenatchee Way
- 5226 Mandan Ct
- 5246 Wenatchee Way
- 5257 Quapaw Way
- 5265 Quapaw Way
- 5220 Mandan Ct
- 5240 Wenatchee Way
- 5249 Quapaw Way
- 5273 Quapaw Way
- 5261 Wenatchee Way
- 5267 Wenatchee Way
- 5255 Wenatchee Way
- 5273 Wenatchee Way
- 5241 Quapaw Way
- 5249 Wenatchee Way
- 5214 Mandan Ct
- 5279 Wenatchee Way
- 5243 Wenatchee Way
- 5233 Quapaw Way
Your Personal Tour Guide
Ask me questions while you tour the home.