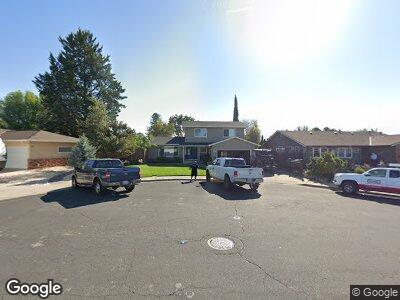
5265 Kisa Ct Livermore, CA 94550
Wagner Farms NeighborhoodEstimated Value: $1,192,877 - $1,351,000
4
Beds
3
Baths
1,811
Sq Ft
$695/Sq Ft
Est. Value
About This Home
This home is located at 5265 Kisa Ct, Livermore, CA 94550 and is currently estimated at $1,258,469, approximately $694 per square foot. 5265 Kisa Ct is a home located in Alameda County with nearby schools including Arroyo Seco Elementary School, East Avenue Middle School, and Livermore High School.
Ownership History
Date
Name
Owned For
Owner Type
Purchase Details
Closed on
Jan 12, 2006
Sold by
Payne Eric and Payne Scarlett
Bought by
Payne Eric C and Payne Scarlett G
Current Estimated Value
Home Financials for this Owner
Home Financials are based on the most recent Mortgage that was taken out on this home.
Original Mortgage
$185,000
Interest Rate
6.32%
Mortgage Type
Credit Line Revolving
Purchase Details
Closed on
Jun 28, 2002
Sold by
Payne Eric and Payne Scarlett
Bought by
Payne Eric and Payne Scarlett
Home Financials for this Owner
Home Financials are based on the most recent Mortgage that was taken out on this home.
Original Mortgage
$300,700
Interest Rate
6.78%
Purchase Details
Closed on
Jun 19, 1998
Sold by
Payne Glenn E and Payne Helen J
Bought by
Payne Eric C and Payne Scarlett G
Home Financials for this Owner
Home Financials are based on the most recent Mortgage that was taken out on this home.
Original Mortgage
$191,250
Interest Rate
7.17%
Create a Home Valuation Report for This Property
The Home Valuation Report is an in-depth analysis detailing your home's value as well as a comparison with similar homes in the area
Home Values in the Area
Average Home Value in this Area
Purchase History
| Date | Buyer | Sale Price | Title Company |
|---|---|---|---|
| Payne Eric C | -- | Ticor Title Co Of California | |
| Payne Eric C | $255,000 | Financial Title Company |
Source: Public Records
Mortgage History
| Date | Status | Borrower | Loan Amount |
|---|---|---|---|
| Open | Payne Eric C | $457,500 | |
| Open | Payne Eric C | $4,987,700 | |
| Closed | Payne Eric C | $318,000 | |
| Closed | Payne Eric C | $185,000 | |
| Closed | Payne Eric | $359,650 | |
| Closed | Payne Eric | $40,500 | |
| Closed | Payne Eric | $322,700 | |
| Closed | Payne Eric | $18,000 | |
| Closed | Payne Eric | $300,700 | |
| Previous Owner | Payne Eric C | $191,250 |
Source: Public Records
Tax History Compared to Growth
Tax History
| Year | Tax Paid | Tax Assessment Tax Assessment Total Assessment is a certain percentage of the fair market value that is determined by local assessors to be the total taxable value of land and additions on the property. | Land | Improvement |
|---|---|---|---|---|
| 2024 | $2,778 | $143,644 | $23,554 | $127,090 |
| 2023 | $2,714 | $147,691 | $23,092 | $124,599 |
| 2022 | $2,653 | $137,795 | $22,639 | $122,156 |
| 2021 | $1,841 | $134,956 | $22,195 | $119,761 |
| 2020 | $2,490 | $140,502 | $21,968 | $118,534 |
| 2019 | $2,482 | $137,747 | $21,537 | $116,210 |
| 2018 | $2,408 | $135,047 | $21,115 | $113,932 |
| 2017 | $2,330 | $132,399 | $20,701 | $111,698 |
| 2016 | $2,218 | $129,803 | $20,295 | $109,508 |
| 2015 | $2,092 | $127,853 | $19,990 | $107,863 |
| 2014 | $2,049 | $125,349 | $19,598 | $105,751 |
Source: Public Records
Map
Nearby Homes
- 5224 Diane Ln
- 5149 Irene Way
- 1109 Lucille St
- 5436 Charlotte Way
- 5108 Diane Ln
- 1330 Juliet Ct
- 766 Joyce St
- 5169 Lillian Ct
- 5191 Lillian Ct
- 642 Debra St
- 709 Katrina St
- 564 Debra St
- 557 Debra St
- 5642 Arlene Way
- 1326 Rebecca Dr
- 5325 Lenore Ave
- 4687 Nicol Common Unit 108
- 618 Loyola Way
- 775 Vivian Dr
- 344 Charlotte Common
- 5265 Kisa Ct
- 5258 Roxanne Ct
- 5233 Kisa Ct
- 5289 Kisa Ct
- 5246 Roxanne Ct
- 5280 Roxanne Ct
- 5219 Kisa Ct
- 5294 Kisa Ct
- 5222 Roxanne Ct
- 5278 Kisa Ct
- 5252 Kisa Ct
- 5230 Kisa Ct
- 5279 Roxanne Ct
- 1072 Roxanne St
- 5245 Roxanne Ct
- 5221 Roxanne Ct
- 1069 Roxanne St
- 5271 Charlotte Way
- 1117 Roxanne St
- 5283 Charlotte Way