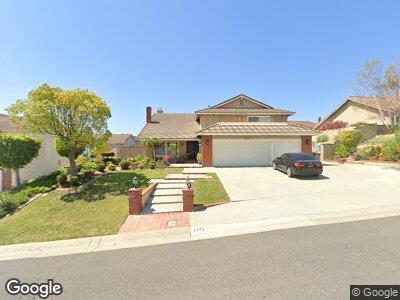
5265 Via Ester Yorba Linda, CA 92886
Estimated Value: $1,733,000 - $1,819,000
4
Beds
3
Baths
2,752
Sq Ft
$648/Sq Ft
Est. Value
About This Home
This home is located at 5265 Via Ester, Yorba Linda, CA 92886 and is currently estimated at $1,783,066, approximately $647 per square foot. 5265 Via Ester is a home located in Orange County with nearby schools including Fairmont Elementary, Bernardo Yorba Middle School, and Ivycrest Montessori Private School - Yorba Linda.
Ownership History
Date
Name
Owned For
Owner Type
Purchase Details
Closed on
Mar 21, 2000
Sold by
Benjamin Menald and Benjamin Maxine
Bought by
Vu An T and Wong Cuc K
Current Estimated Value
Home Financials for this Owner
Home Financials are based on the most recent Mortgage that was taken out on this home.
Original Mortgage
$329,000
Interest Rate
8.34%
Purchase Details
Closed on
Mar 12, 1999
Sold by
Mei Fa Wang Diana Ya Ying
Bought by
Menald Benjamin and Menald Maxine
Home Financials for this Owner
Home Financials are based on the most recent Mortgage that was taken out on this home.
Original Mortgage
$320,000
Interest Rate
6.91%
Purchase Details
Closed on
Mar 7, 1994
Sold by
Wang Diana Ya Ying
Bought by
Wang Diana Ya Ying and Chen William W
Create a Home Valuation Report for This Property
The Home Valuation Report is an in-depth analysis detailing your home's value as well as a comparison with similar homes in the area
Home Values in the Area
Average Home Value in this Area
Purchase History
| Date | Buyer | Sale Price | Title Company |
|---|---|---|---|
| Vu An T | $470,000 | -- | |
| Menald Benjamin | $400,000 | Fidelity National Title Ins | |
| Wang Diana Ya Ying | -- | -- |
Source: Public Records
Mortgage History
| Date | Status | Borrower | Loan Amount |
|---|---|---|---|
| Closed | Vu An T | $256,000 | |
| Closed | Vu An T | $275,000 | |
| Closed | Vu An T | $329,000 | |
| Previous Owner | Menald Benjamin | $320,000 |
Source: Public Records
Tax History Compared to Growth
Tax History
| Year | Tax Paid | Tax Assessment Tax Assessment Total Assessment is a certain percentage of the fair market value that is determined by local assessors to be the total taxable value of land and additions on the property. | Land | Improvement |
|---|---|---|---|---|
| 2024 | $9,078 | $708,208 | $413,504 | $294,704 |
| 2023 | $8,902 | $694,322 | $405,396 | $288,926 |
| 2022 | $8,763 | $680,708 | $397,447 | $283,261 |
| 2021 | $8,591 | $667,361 | $389,654 | $277,707 |
| 2020 | $8,477 | $660,519 | $385,659 | $274,860 |
| 2019 | $8,190 | $647,568 | $378,097 | $269,471 |
| 2018 | $8,070 | $634,871 | $370,683 | $264,188 |
| 2017 | $7,931 | $622,423 | $363,415 | $259,008 |
| 2016 | $7,709 | $610,219 | $356,289 | $253,930 |
| 2015 | $7,305 | $601,053 | $350,937 | $250,116 |
| 2014 | $7,095 | $589,280 | $344,063 | $245,217 |
Source: Public Records
Map
Nearby Homes
- 5034 Vista Montana
- 5395 Via Fonte
- 5110 Via Donaldo
- 5495 Via Rene
- 5505 Paseo Joaquin
- 20472 Via Marwah
- 5435 Vista Del Mar
- 5475 Vista Del Mar
- 5280 Via Brumosa
- 4225 Fairmont Blvd
- 5340 Via Sevilla
- 20665 Via Tapaste
- 5275 Lynridge Dr
- 91 VAC/COR E Avenue L
- 0 Bridal Hills Unit TR23132686
- 5435 Via Cervantes
- 20420 Via Canarias
- 19741 Fernwood Plaza
- 4780 Escalona Plaza
- 19721 Parkview Terrace Unit TE
- 5265 Via Ester
- 5275 Via Ester
- 5255 Via Ester
- 5308 Via Geraldina
- 5280 Via Geraldina
- 5312 Via Geraldina
- 5260 Via Ester
- 5270 Via Ester
- 5247 Via Ester
- 5285 Via Ester
- 5250 Via Ester
- 5260 Via Geraldina
- 5318 Via Geraldina
- 5280 Via Ester
- 5248 Via Ester
- 5297 Via Geraldina
- 5311 Via Geraldina
- 5185 Via Margarita
- 5258 Via Geraldina
- 5175 Via Margarita