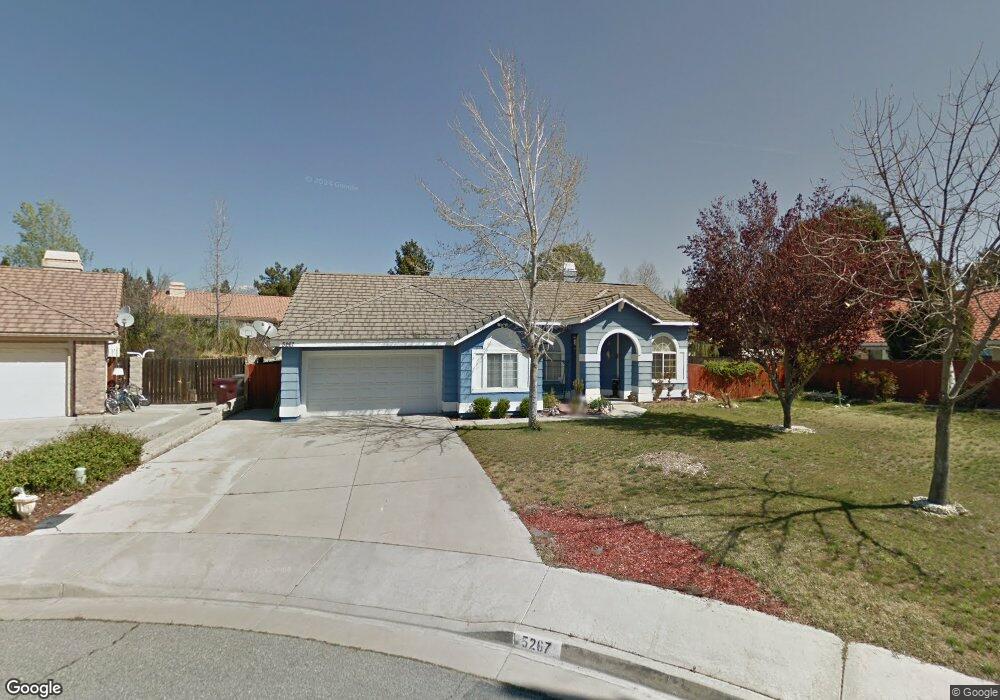
5267 Spring View Dr Banning, CA 92220
Estimated Value: $395,000 - $522,000
3
Beds
2
Baths
1,576
Sq Ft
$286/Sq Ft
Est. Value
About This Home
This home is located at 5267 Spring View Dr, Banning, CA 92220 and is currently estimated at $450,275, approximately $285 per square foot. 5267 Spring View Dr is a home located in Riverside County with nearby schools including Sundance Elementary School, San Gorgonio Middle School, and Beaumont Senior High School.
Ownership History
Date
Name
Owned For
Owner Type
Purchase Details
Closed on
Apr 22, 2025
Sold by
Chotiswatdi Surasakdi and Chotiswatdi Lydia Jaye
Bought by
Chotiswatdi Family Trust and Chotiswatdi
Current Estimated Value
Purchase Details
Closed on
Mar 9, 2011
Sold by
Thompson Victoria B
Bought by
Chotiswatdi Surasakdi and Chotiswatdi Lydia J
Home Financials for this Owner
Home Financials are based on the most recent Mortgage that was taken out on this home.
Original Mortgage
$110,400
Interest Rate
4.96%
Mortgage Type
New Conventional
Purchase Details
Closed on
Oct 7, 2010
Sold by
Thompson Harry L
Bought by
Thompson Victoria B
Purchase Details
Closed on
Nov 13, 2002
Sold by
Thompson Victoria B and Holleron Victoria B
Bought by
Thompson Harry L and Thompson Victoria B
Home Financials for this Owner
Home Financials are based on the most recent Mortgage that was taken out on this home.
Original Mortgage
$117,500
Interest Rate
5.96%
Create a Home Valuation Report for This Property
The Home Valuation Report is an in-depth analysis detailing your home's value as well as a comparison with similar homes in the area
Home Values in the Area
Average Home Value in this Area
Purchase History
| Date | Buyer | Sale Price | Title Company |
|---|---|---|---|
| Chotiswatdi Family Trust | -- | None Listed On Document | |
| Chotiswatdi Surasakdi | $138,000 | Western Resources Title Co | |
| Thompson Victoria B | -- | None Available | |
| Thompson Harry L | -- | Commonwealth Land Title Co |
Source: Public Records
Mortgage History
| Date | Status | Borrower | Loan Amount |
|---|---|---|---|
| Previous Owner | Chotiswatdi Surasakdi | $110,400 | |
| Previous Owner | Thompson Harry L | $117,500 |
Source: Public Records
Tax History
| Year | Tax Paid | Tax Assessment Tax Assessment Total Assessment is a certain percentage of the fair market value that is determined by local assessors to be the total taxable value of land and additions on the property. | Land | Improvement |
|---|---|---|---|---|
| 2025 | $2,425 | $176,785 | $64,048 | $112,737 |
| 2023 | $2,425 | $169,922 | $61,562 | $108,360 |
| 2022 | $2,390 | $166,591 | $60,355 | $106,236 |
| 2021 | $2,348 | $163,325 | $59,172 | $104,153 |
| 2020 | $2,324 | $161,652 | $58,566 | $103,086 |
| 2019 | $2,289 | $158,483 | $57,418 | $101,065 |
| 2018 | $2,280 | $155,377 | $56,294 | $99,083 |
| 2017 | $2,246 | $152,332 | $55,191 | $97,141 |
| 2016 | $2,190 | $149,346 | $54,109 | $95,237 |
| 2015 | $2,156 | $147,105 | $53,298 | $93,807 |
| 2014 | $2,157 | $144,225 | $52,255 | $91,970 |
Source: Public Records
Map
Nearby Homes
- 724 Kingswell Ave
- 5362 W Hoffer St
- 968 Mahogany St
- 5392 W Hoffer St
- 5367 W Hoffer St
- 5370 Echo Dr
- 1022 Mahogany St
- 217 Beverly Dr
- 5422 Echo Dr
- 401 Marian Way
- 959 Rockcress Ln
- 2271 Linden Ln
- 5478 Evelyn Dr
- 5405 Pinedrop Cir
- 1158 Mahogany St
- 5373 Pinedrop Cir
- 4912 Corral Cir
- 1190 Mahogany St
- 1131 Rockcress Ln
- 300 Apex Ave
- 5289 Spring View Dr
- 665 Kingswell Ave
- 691 Kingswell Ave
- 5214 Prospector Cir
- 5192 Prospector Cir
- 639 Kingswell Ave
- 5238 Prospector Cir
- 5170 Prospector Cir
- 5280 Spring View Dr
- 5260 Prospector Cir
- 698 Kingswell Ave
- 5216 Spring View Dr
- 672 Kingswell Ave
- 5282 Prospector Cir
- 5213 Prospector Cir
- 5191 Prospector Cir
- 620 Kingswell Ave
- 5194 Spring View Dr
- 736 Kingswell Ave
Your Personal Tour Guide
Ask me questions while you tour the home.