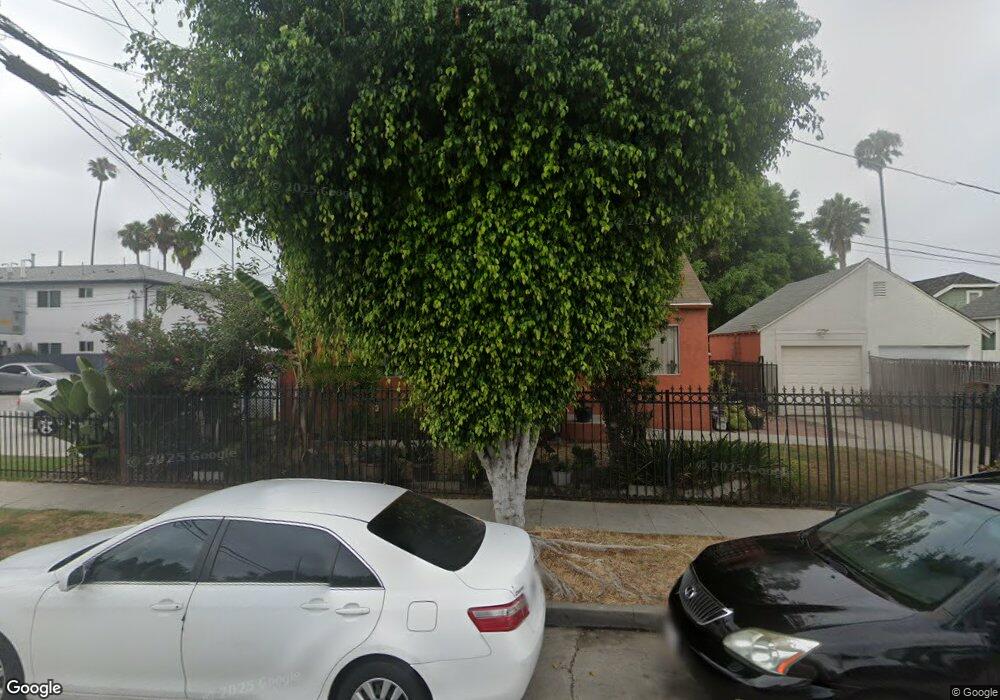
5268 Saturn St Los Angeles, CA 90019
Mid-City NeighborhoodEstimated Value: $754,000 - $998,000
3
Beds
1
Bath
964
Sq Ft
$931/Sq Ft
Est. Value
About This Home
This home is located at 5268 Saturn St, Los Angeles, CA 90019 and is currently estimated at $897,642, approximately $931 per square foot. 5268 Saturn St is a home located in Los Angeles County with nearby schools including Saturn Street Elementary School, Fairfax High School, and New Los Angeles Charter.
Ownership History
Date
Name
Owned For
Owner Type
Purchase Details
Closed on
Oct 26, 2018
Sold by
Purifoy Mary K
Bought by
Purifoy Mary K and The Mary K Purifoy Revocable L
Current Estimated Value
Purchase Details
Closed on
May 21, 2002
Sold by
Purifey Mary K
Bought by
Purifoy Mary K
Home Financials for this Owner
Home Financials are based on the most recent Mortgage that was taken out on this home.
Original Mortgage
$126,000
Outstanding Balance
$53,055
Interest Rate
6.89%
Estimated Equity
$844,587
Purchase Details
Closed on
Mar 5, 1998
Sold by
Federal National Mortgage Association
Bought by
Purifey Mary K and Benson Purifey Kevin A
Home Financials for this Owner
Home Financials are based on the most recent Mortgage that was taken out on this home.
Original Mortgage
$132,600
Interest Rate
7.05%
Mortgage Type
FHA
Purchase Details
Closed on
Jul 21, 1997
Sold by
Ryan Nancy and Federal National Mortgage Asso
Bought by
Federal National Mortgage Association
Create a Home Valuation Report for This Property
The Home Valuation Report is an in-depth analysis detailing your home's value as well as a comparison with similar homes in the area
Home Values in the Area
Average Home Value in this Area
Purchase History
| Date | Buyer | Sale Price | Title Company |
|---|---|---|---|
| Purifoy Mary K | -- | None Available | |
| Purifoy Mary K | -- | First American Title Co | |
| Purifey Mary K | $90,000 | Progressive Title Company | |
| Federal National Mortgage Association | $105,161 | First American Title Ins Co |
Source: Public Records
Mortgage History
| Date | Status | Borrower | Loan Amount |
|---|---|---|---|
| Open | Purifoy Mary K | $126,000 | |
| Previous Owner | Purifey Mary K | $132,600 |
Source: Public Records
Tax History Compared to Growth
Tax History
| Year | Tax Paid | Tax Assessment Tax Assessment Total Assessment is a certain percentage of the fair market value that is determined by local assessors to be the total taxable value of land and additions on the property. | Land | Improvement |
|---|---|---|---|---|
| 2025 | $3,693 | $299,328 | $216,280 | $83,048 |
| 2024 | $3,693 | $293,460 | $212,040 | $81,420 |
| 2023 | $3,627 | $287,707 | $207,883 | $79,824 |
| 2022 | $3,463 | $282,066 | $203,807 | $78,259 |
| 2021 | $3,415 | $276,536 | $199,811 | $76,725 |
| 2019 | $3,315 | $268,336 | $193,886 | $74,450 |
| 2018 | $3,281 | $263,076 | $190,085 | $72,991 |
| 2017 | $3,212 | $257,918 | $186,358 | $71,560 |
| 2016 | $3,134 | $252,861 | $182,704 | $70,157 |
| 2015 | $3,089 | $249,064 | $179,960 | $69,104 |
| 2014 | $3,108 | $244,186 | $176,435 | $67,751 |
Source: Public Records
Map
Nearby Homes
- 1432 S Cloverdale Ave
- 5173 Pickford St
- 1807 Cochran Place
- 1421 S Ridgeley Dr
- 1500 Hauser Blvd
- 1618 S Burnside Ave
- 1851 S Cloverdale Ave
- 1812 S Dunsmuir Ave
- 1614 Hauser Blvd
- 1867 S Cochran Ave
- 1502 S Redondo Blvd
- 1419 S Redondo Blvd
- 1359 S Ridgeley Dr
- 1357 S Cloverdale Ave
- 1623 S Sycamore Ave
- 1861 S Redondo Blvd
- 1358 S Cloverdale Ave
- 1327 S Burnside Ave
- 1820 Alsace Ave
- 1840 S Dunsmuir Ave
- 1506 S Dunsmuir Ave
- 1502 S Dunsmuir Ave
- 1503 S Cochran Ave Unit 1B
- 1503 S Cochran Ave
- 1510 S Dunsmuir Ave
- 1505 S Cochran Ave
- 1505 S Cochran Ave Unit 4
- 1505 S Cochran Ave Unit 1
- 1505 S Cochran Ave Unit 6
- 1464 S Dunsmuir Ave
- 1511 S Cochran Ave
- 5267 Saturn St
- 5269 Saturn St
- 1516 S Dunsmuir Ave
- 1517 S Cochran Ave
- 1458 S Dunsmuir Ave
- 1520 S Dunsmuir Ave
- 1505 S Dunsmuir Ave
- 1465 S Cochran Ave
- 1471 S Cochran Ave