5269 N Laporte Ave Chicago, IL 60630
Jefferson Park NeighborhoodEstimated Value: $358,000 - $581,000
2
Beds
1
Bath
1,020
Sq Ft
$460/Sq Ft
Est. Value
About This Home
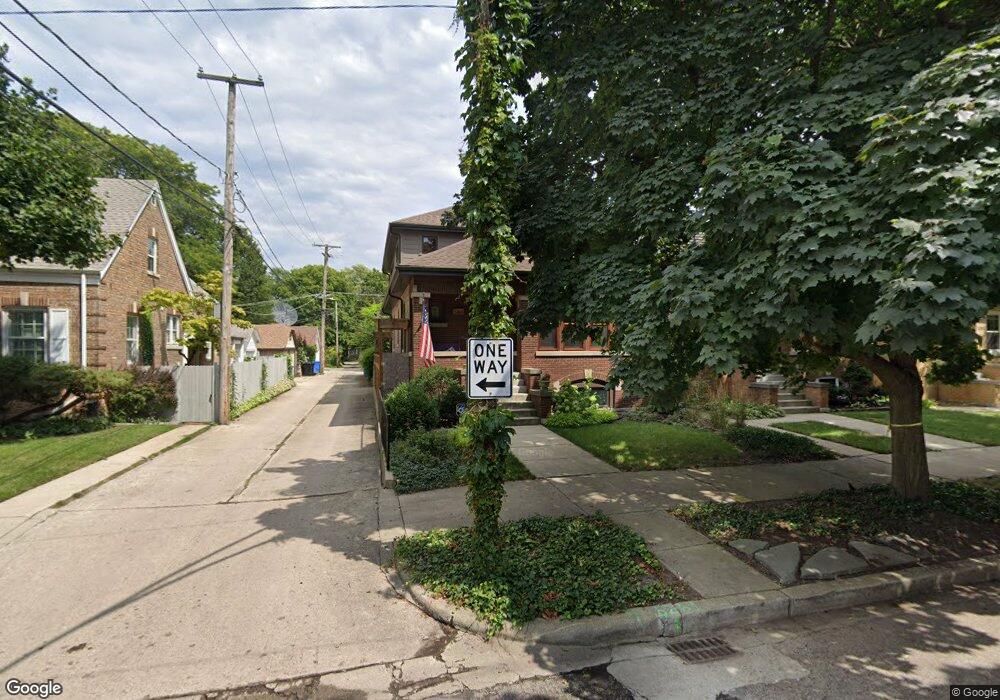
This home is located at 5269 N Laporte Ave, Chicago, IL 60630 and is currently estimated at $469,231, approximately $460 per square foot. 5269 N Laporte Ave is a home located in Cook County with nearby schools including Beaubien Elementary School, William Howard Taft High School, and Queen Of All Saints School.
Ownership History
Date
Name
Owned For
Owner Type
Purchase Details
Closed on
May 23, 2023
Sold by
Nykaza Jennifer A and Zwagerman Jennifer A
Bought by
Zwagerman Jennifer N and Zwagerman Richard
Current Estimated Value
Home Financials for this Owner
Home Financials are based on the most recent Mortgage that was taken out on this home.
Original Mortgage
$630,000
Outstanding Balance
$610,411
Interest Rate
6.38%
Mortgage Type
New Conventional
Estimated Equity
-$141,180
Purchase Details
Closed on
May 20, 2008
Sold by
Julia Nartea North Revocable
Bought by
Nykaza Jennifer A
Home Financials for this Owner
Home Financials are based on the most recent Mortgage that was taken out on this home.
Original Mortgage
$105,000
Interest Rate
5.93%
Mortgage Type
Unknown
Purchase Details
Closed on
Jan 14, 2005
Sold by
Cole Taylor Bank
Bought by
522 & 30 W Cornelia Llc
Home Financials for this Owner
Home Financials are based on the most recent Mortgage that was taken out on this home.
Original Mortgage
$5,800,000
Interest Rate
5.83%
Mortgage Type
Construction
Purchase Details
Closed on
Dec 24, 1999
Sold by
North Julie Nartea
Bought by
Nartea Julia and Julia Nartea North Revocable Trust
Create a Home Valuation Report for This Property
The Home Valuation Report is an in-depth analysis detailing your home's value as well as a comparison with similar homes in the area
Home Values in the Area
Average Home Value in this Area
Purchase History
| Date | Buyer | Sale Price | Title Company |
|---|---|---|---|
| Zwagerman Jennifer N | -- | None Listed On Document | |
| Nykaza Jennifer A | $295,000 | Republic Title Co | |
| 522 & 30 W Cornelia Llc | $4,800,000 | First American | |
| Nartea Julia | -- | -- |
Source: Public Records
Mortgage History
| Date | Status | Borrower | Loan Amount |
|---|---|---|---|
| Open | Zwagerman Jennifer N | $630,000 | |
| Previous Owner | Nykaza Jennifer A | $105,000 | |
| Previous Owner | 522 & 30 W Cornelia Llc | $5,800,000 |
Source: Public Records
Tax History
| Year | Tax Paid | Tax Assessment Tax Assessment Total Assessment is a certain percentage of the fair market value that is determined by local assessors to be the total taxable value of land and additions on the property. | Land | Improvement |
|---|---|---|---|---|
| 2025 | $6,541 | $38,638 | $11,873 | $26,765 |
| 2024 | $6,541 | $38,638 | $11,873 | $26,765 |
| 2023 | $6,907 | $40,465 | $9,575 | $30,890 |
| 2022 | $6,907 | $43,148 | $9,575 | $33,573 |
| 2021 | $6,771 | $36,982 | $9,575 | $27,407 |
| 2020 | $4,970 | $25,399 | $5,170 | $20,229 |
| 2019 | $4,984 | $28,222 | $5,170 | $23,052 |
| 2018 | $4,899 | $28,222 | $5,170 | $23,052 |
| 2017 | $4,923 | $26,234 | $4,596 | $21,638 |
| 2016 | $4,447 | $24,690 | $4,596 | $20,094 |
| 2015 | $4,455 | $26,919 | $4,596 | $22,323 |
| 2014 | $3,821 | $23,150 | $3,830 | $19,320 |
| 2013 | $3,735 | $23,150 | $3,830 | $19,320 |
Source: Public Records
Map
Nearby Homes
- 4823 W Balmoral Ave
- 4944 W Winona St
- 5037 W Winona St
- 5019 W Carmen Ave
- 5363 N Latrobe Ave
- 4855 W Argyle St
- 5229 W Carmen Ave
- 5300 W Foster Ave
- 4551 W Foster Ave
- 5130-50 N Cicero Ave
- 4940 W Ainslie St
- 5113 W Strong St
- 5061 N Kimberly Ave
- 5015 N Kimberly Ave
- 5787 N Clifford Ave
- 5630 N Kenton Ave
- 5028 W Lawrence Ave
- 5360 N Lynch Ave
- 5658 N Latrobe Ave
- 5207 N Ludlam Ave
- 5267 N Laporte Ave
- 5275 N Laporte Ave
- 5261 N Laporte Ave
- 5279 N Laporte Ave
- 4915 W Berwyn Ave
- 5257 N Laporte Ave
- 4911 W Berwyn Ave
- 4919 W Berwyn Ave
- 4909 W Berwyn Ave
- 5268 N Lamon Ave
- 5255 N Laporte Ave
- 5264 N Lamon Ave
- 5268 N Laporte Ave
- 5268 N Laporte Ave Unit 2
- 5260 N Lamon Ave
- 5276 N Lamon Ave
- 5258 N Laporte Ave
- 5003 W Berwyn Ave
- 5258 N Lamon Ave
- 5251 N Laporte Ave
Your Personal Tour Guide
Ask me questions while you tour the home.