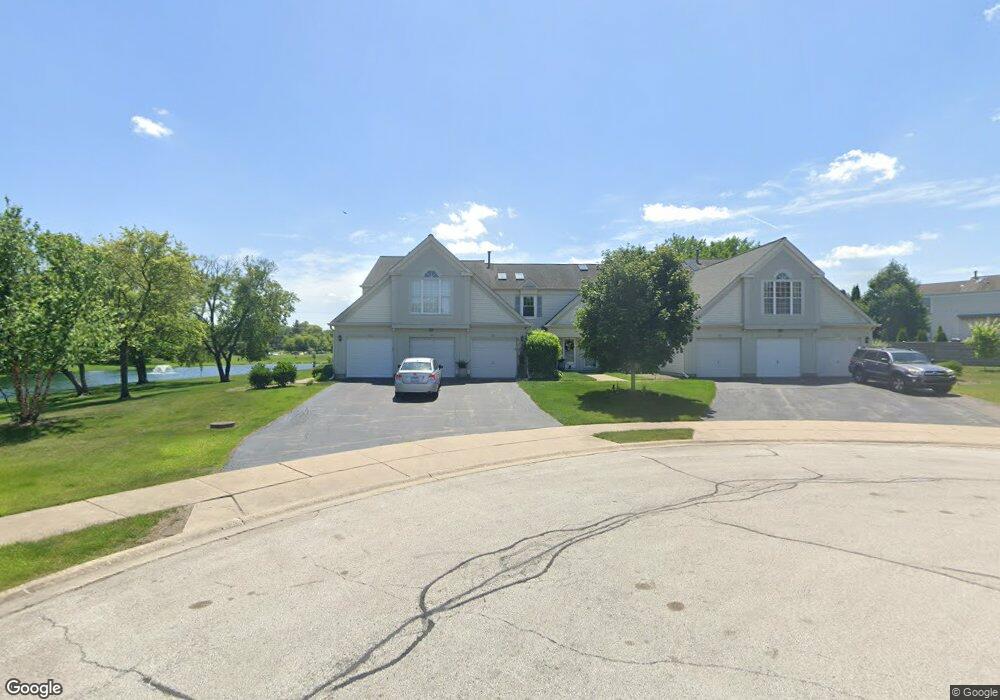
527 Bridle Trail Unit 164 Wheeling, IL 60090
Estimated Value: $254,000 - $300,000
2
Beds
2
Baths
178,310
Sq Ft
$2/Sq Ft
Est. Value
About This Home
This home is located at 527 Bridle Trail Unit 164, Wheeling, IL 60090 and is currently estimated at $276,829, approximately $1 per square foot. 527 Bridle Trail Unit 164 is a home located in Cook County with nearby schools including Dwight D Eisenhower Elementary School, Anne Sullivan Elementary School, and Betsy Ross Elementary School.
Ownership History
Date
Name
Owned For
Owner Type
Purchase Details
Closed on
Jul 13, 2004
Sold by
Cendant Mobility Financial Corp
Bought by
Solaka Ninos
Current Estimated Value
Home Financials for this Owner
Home Financials are based on the most recent Mortgage that was taken out on this home.
Original Mortgage
$176,000
Interest Rate
5.87%
Mortgage Type
Unknown
Purchase Details
Closed on
May 13, 2004
Sold by
Debbouz Amar and Debbouz Soraya
Bought by
Cendant Mobility Financial Corp
Purchase Details
Closed on
Feb 11, 2003
Sold by
Midwest Bank & Trust Co
Bought by
Debbouz Amar and Debbouz Soraya
Home Financials for this Owner
Home Financials are based on the most recent Mortgage that was taken out on this home.
Original Mortgage
$122,500
Interest Rate
6.07%
Purchase Details
Closed on
Nov 18, 1999
Sold by
Q T S Corp
Bought by
Midwest Trust Services and Trust #89-11-5873
Create a Home Valuation Report for This Property
The Home Valuation Report is an in-depth analysis detailing your home's value as well as a comparison with similar homes in the area
Home Values in the Area
Average Home Value in this Area
Purchase History
| Date | Buyer | Sale Price | Title Company |
|---|---|---|---|
| Solaka Ninos | $220,000 | Bt | |
| Cendant Mobility Financial Corp | $220,000 | Bt | |
| Debbouz Amar | $175,000 | -- | |
| Midwest Trust Services | $86,500 | -- |
Source: Public Records
Mortgage History
| Date | Status | Borrower | Loan Amount |
|---|---|---|---|
| Previous Owner | Solaka Ninos | $176,000 | |
| Previous Owner | Debbouz Amar | $122,500 | |
| Closed | Solaka Ninos | $44,000 |
Source: Public Records
Tax History Compared to Growth
Tax History
| Year | Tax Paid | Tax Assessment Tax Assessment Total Assessment is a certain percentage of the fair market value that is determined by local assessors to be the total taxable value of land and additions on the property. | Land | Improvement |
|---|---|---|---|---|
| 2024 | $4,769 | $19,355 | $5,098 | $14,257 |
| 2023 | $4,526 | $19,355 | $5,098 | $14,257 |
| 2022 | $4,526 | $19,355 | $5,098 | $14,257 |
| 2021 | $4,006 | $15,427 | $579 | $14,848 |
| 2020 | $3,971 | $15,427 | $579 | $14,848 |
| 2019 | $3,995 | $17,217 | $579 | $16,638 |
| 2018 | $2,921 | $12,611 | $463 | $12,148 |
| 2017 | $2,898 | $12,611 | $463 | $12,148 |
| 2016 | $2,951 | $12,611 | $463 | $12,148 |
| 2015 | $2,601 | $10,840 | $2,664 | $8,176 |
| 2014 | $2,698 | $11,318 | $2,664 | $8,654 |
| 2013 | $2,600 | $11,318 | $2,664 | $8,654 |
Source: Public Records
Map
Nearby Homes
- 1430 Sandstone Dr Unit 202
- 1425 Sandpebble Dr Unit 340
- 1450 Sandpebble Dr Unit 333
- 1450 Sandpebble Dr Unit 227
- 688 Equestrian Dr
- 1201 Pleasant Run Dr Unit 312
- 1500 Sandstone Dr Unit 307
- 1054 Shady Tree Ln
- 1550 Sandpebble Dr Unit 307
- 1550 Sandpebble Dr Unit 209
- 1575 Sandpebble Dr Unit 226
- 1575 Sandpebble Dr Unit 336
- 9 Kenneth Ave
- 940 Tanglewood Dr
- 1014 N Elmhurst Rd
- 802 Andover Ct
- 21 E Stonegate Dr
- 11 W Palatine Rd
- 150 Lucerne Ct Unit 51713
- 161 Lucerne Ct Unit 111713
- 531 Bridle Trail Unit 165
- 525 Bridle Trail Unit 163
- 529 Bridle Trail Unit 166
- 521 Bridle Trail Unit 162
- 523 Bridle Trail Unit 161
- 1295 S Paddock Dr
- 1305 S Paddock Dr
- 530 Bridle Trail Unit 172
- 1285 S Paddock Dr
- 526 Bridle Trail Unit 173
- 1315 S Paddock Dr
- 524 Bridle Trail Unit 174
- 528 Bridle Trail Unit 171
- 520 Bridle Trail Unit 175
- 1275 S Paddock Dr
- 510 Bridle Trail Unit 182
- 1325 S Paddock Dr
- 522 Bridle Trail Unit 176
- 508 Bridle Trail Unit 181
- 506 Bridle Trail Unit 183