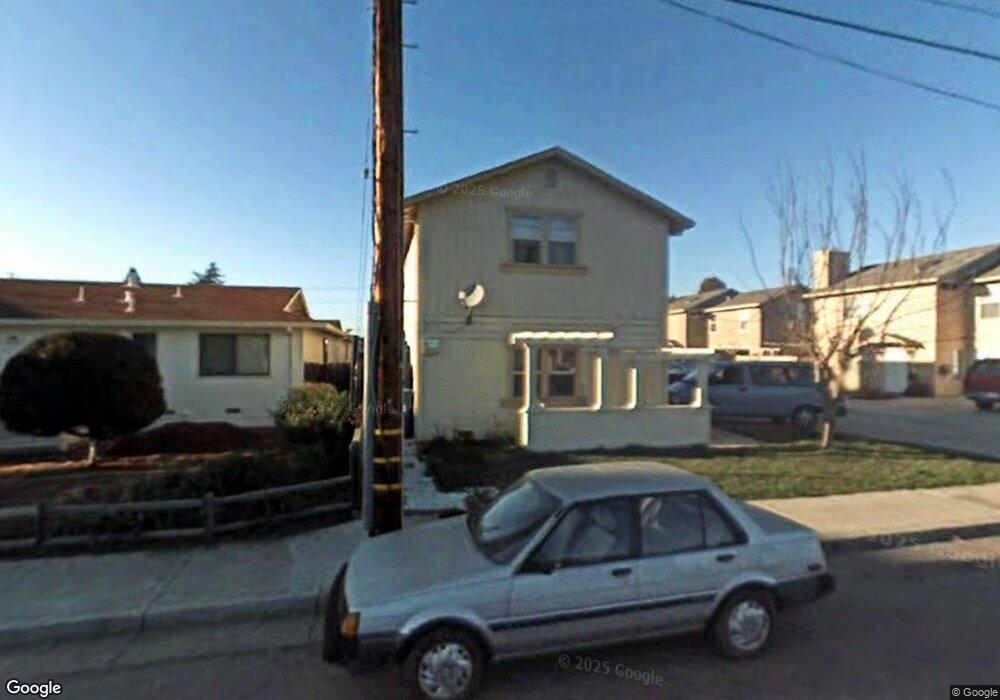
527 Center St Unit A Watsonville, CA 95076
Estimated Value: $583,000 - $764,000
3
Beds
3
Baths
1,440
Sq Ft
$476/Sq Ft
Est. Value
About This Home
This home is located at 527 Center St Unit A, Watsonville, CA 95076 and is currently estimated at $685,697, approximately $476 per square foot. 527 Center St Unit A is a home located in Santa Cruz County with nearby schools including Ann Soldo Elementary School, Lakeview Middle School, and Watsonville High School.
Ownership History
Date
Name
Owned For
Owner Type
Purchase Details
Closed on
Mar 10, 1999
Sold by
Fiorovich Johnnie M
Bought by
Jimenez Pedro G and Jimenez Maria G
Current Estimated Value
Home Financials for this Owner
Home Financials are based on the most recent Mortgage that was taken out on this home.
Original Mortgage
$155,000
Outstanding Balance
$37,353
Interest Rate
6.7%
Mortgage Type
Stand Alone First
Estimated Equity
$648,344
Create a Home Valuation Report for This Property
The Home Valuation Report is an in-depth analysis detailing your home's value as well as a comparison with similar homes in the area
Home Values in the Area
Average Home Value in this Area
Purchase History
| Date | Buyer | Sale Price | Title Company |
|---|---|---|---|
| Jimenez Pedro G | $195,000 | Santa Cruz Title Company |
Source: Public Records
Mortgage History
| Date | Status | Borrower | Loan Amount |
|---|---|---|---|
| Open | Jimenez Pedro G | $155,000 | |
| Closed | Jimenez Pedro G | $20,000 |
Source: Public Records
Tax History Compared to Growth
Tax History
| Year | Tax Paid | Tax Assessment Tax Assessment Total Assessment is a certain percentage of the fair market value that is determined by local assessors to be the total taxable value of land and additions on the property. | Land | Improvement |
|---|---|---|---|---|
| 2025 | $3,517 | $305,706 | $126,516 | $179,190 |
| 2023 | $3,462 | $293,836 | $121,604 | $172,232 |
| 2022 | $3,399 | $288,074 | $119,219 | $168,855 |
| 2021 | $3,340 | $282,426 | $116,882 | $165,544 |
| 2020 | $3,292 | $279,530 | $115,683 | $163,847 |
| 2019 | $3,233 | $274,049 | $113,415 | $160,634 |
| 2018 | $3,150 | $268,675 | $111,191 | $157,484 |
| 2017 | $3,121 | $263,407 | $109,010 | $154,397 |
| 2016 | $3,038 | $258,243 | $106,873 | $151,370 |
| 2015 | $3,027 | $254,364 | $105,268 | $149,096 |
| 2014 | $2,960 | $249,381 | $103,206 | $146,175 |
Source: Public Records
Map
Nearby Homes