Estimated Value: $354,000 - $394,000
2
Beds
1
Bath
1,219
Sq Ft
$304/Sq Ft
Est. Value
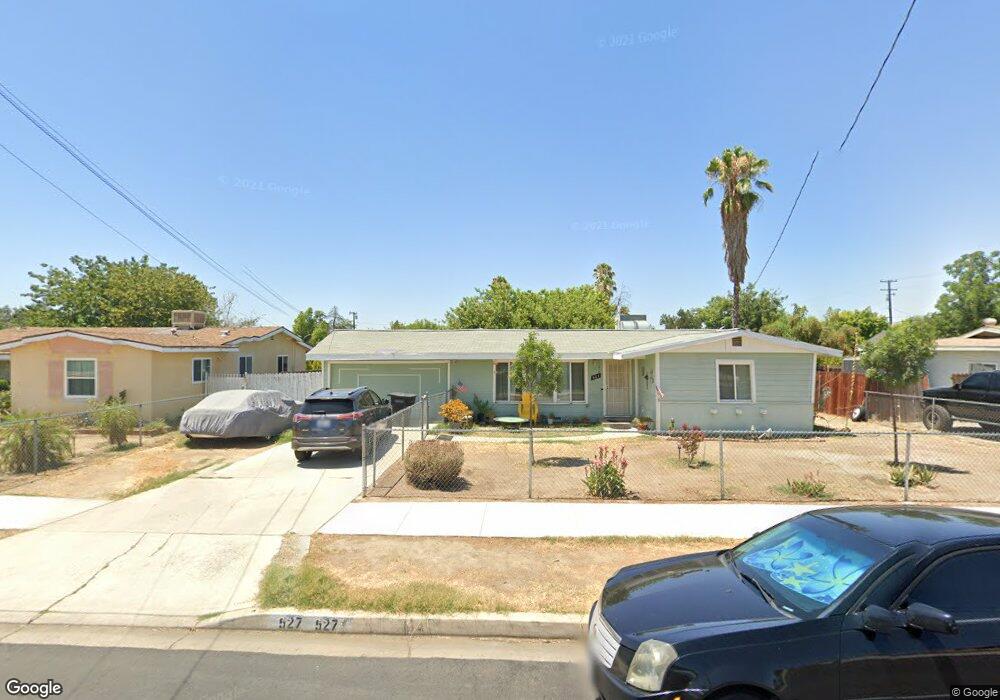
About This Home
This home is located at 527 S Taylor St, Hemet, CA 92543 and is currently estimated at $370,385, approximately $303 per square foot. 527 S Taylor St is a home located in Riverside County with nearby schools including Whittier Elementary School, Acacia Middle School, and West Valley High School.
Ownership History
Date
Name
Owned For
Owner Type
Purchase Details
Closed on
Oct 22, 2021
Sold by
Maring Barbara J
Bought by
Daniel J Maring And Barbara J Maring Family T
Current Estimated Value
Purchase Details
Closed on
Nov 8, 2010
Sold by
Wells Fargo Bank Na
Bought by
Maring Daniel J and Maring Barbara J
Purchase Details
Closed on
Sep 1, 2010
Sold by
Thornton Billy T
Bought by
Wells Fargo Bank Na
Purchase Details
Closed on
Oct 23, 2006
Sold by
Thornton Sarah
Bought by
Thornton Ii Billy T
Home Financials for this Owner
Home Financials are based on the most recent Mortgage that was taken out on this home.
Original Mortgage
$254,140
Interest Rate
6.28%
Mortgage Type
Purchase Money Mortgage
Purchase Details
Closed on
Oct 2, 2006
Sold by
Thornton Billy Thomas
Bought by
Thornton Ii Billy Thomas and Thornton Sarah
Home Financials for this Owner
Home Financials are based on the most recent Mortgage that was taken out on this home.
Original Mortgage
$254,140
Interest Rate
6.28%
Mortgage Type
Purchase Money Mortgage
Create a Home Valuation Report for This Property
The Home Valuation Report is an in-depth analysis detailing your home's value as well as a comparison with similar homes in the area
Purchase History
| Date | Buyer | Sale Price | Title Company |
|---|---|---|---|
| Daniel J Maring And Barbara J Maring Family T | -- | None Listed On Document | |
| Maring Daniel J | $63,000 | Servicelink | |
| Wells Fargo Bank Na | $258,888 | Accommodation | |
| Thornton Ii Billy T | -- | Stewart Title Of Ca Inc | |
| Thornton Ii Billy Thomas | -- | Stewart Title Of Ca Inc | |
| Thornton Ii Billy T | $262,000 | Stewart Title Of Ca Inc |
Source: Public Records
Mortgage History
| Date | Status | Borrower | Loan Amount |
|---|---|---|---|
| Previous Owner | Thornton Ii Billy T | $254,140 |
Source: Public Records
Tax History
| Year | Tax Paid | Tax Assessment Tax Assessment Total Assessment is a certain percentage of the fair market value that is determined by local assessors to be the total taxable value of land and additions on the property. | Land | Improvement |
|---|---|---|---|---|
| 2025 | $1,006 | $80,698 | $25,615 | $55,083 |
| 2023 | $1,006 | $77,566 | $24,621 | $52,945 |
| 2022 | $980 | $76,046 | $24,139 | $51,907 |
| 2021 | $966 | $74,556 | $23,666 | $50,890 |
| 2020 | $973 | $73,793 | $23,424 | $50,369 |
| 2019 | $954 | $72,347 | $22,965 | $49,382 |
| 2018 | $928 | $70,929 | $22,516 | $48,413 |
| 2017 | $918 | $69,539 | $22,075 | $47,464 |
| 2016 | $913 | $68,177 | $21,643 | $46,534 |
| 2015 | $910 | $67,155 | $21,319 | $45,836 |
| 2014 | $874 | $65,841 | $20,902 | $44,939 |
Source: Public Records
Map
Nearby Homes
- 0 E Central Ave Unit SW25225499
- 532 Fern Place
- 616 S Santa fe St Unit 7
- 327 S Taylor St
- 622 S Santa fe St Unit 6
- 609 S Buena Vista St
- 618 S Santa fe St Unit 8
- 695 S Santa fe St
- 541 S San Jacinto St
- 932 Griffith Way
- 721 S Santa fe St
- 670 Lanier St
- 1113 E Acacia Ave
- 1210 E Whittier Ave
- 1287 Olive Tree Ln
- 661 S Carmalita St
- 0 E Whittier Ave
- 1226 Lucerne Dr
- 1315 E Whittier Ave
- 26401 Olive Dr
- 545 S Taylor St
- 517 S Taylor St
- 555 S Taylor St
- 755 E Mayberry Ave
- 516 S Taylor St
- 532 S Thompson St
- 542 S Thompson St
- 532 S Taylor St
- 522 S Thompson St
- 735 E Mayberry Ave
- 542 S Taylor St
- 542 S Taylor St
- 565 S Taylor St
- 803 E Mayberry Ave
- 703 E Mayberry Ave
- 552 S Taylor St
- 825 E Mayberry Ave
- 562 S Thompson St
- 575 S Taylor St
Your Personal Tour Guide
Ask me questions while you tour the home.