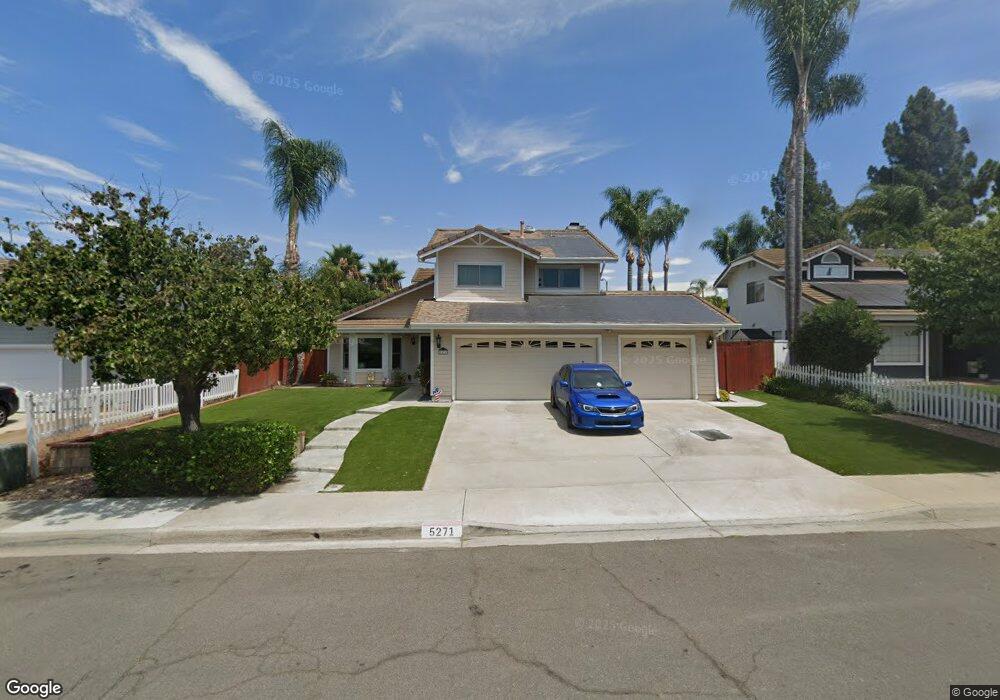
5271 Hubbert St Oceanside, CA 92056
Guajome NeighborhoodEstimated Value: $883,767 - $944,000
3
Beds
3
Baths
1,622
Sq Ft
$560/Sq Ft
Est. Value
About This Home
This home is located at 5271 Hubbert St, Oceanside, CA 92056 and is currently estimated at $908,192, approximately $559 per square foot. 5271 Hubbert St is a home located in San Diego County with nearby schools including Alamosa Park Elementary School, Roosevelt Middle School, and Vista High School.
Ownership History
Date
Name
Owned For
Owner Type
Purchase Details
Closed on
Aug 3, 2023
Sold by
Bautista Nino A and Bautista Candace P
Bought by
Nino And Candace Bautista Family Trust and Bautista
Current Estimated Value
Purchase Details
Closed on
Jul 7, 1995
Sold by
Borja Joseph A and Borja Paulette L
Bought by
Bautista Nino A and Bautista Candace P
Home Financials for this Owner
Home Financials are based on the most recent Mortgage that was taken out on this home.
Original Mortgage
$169,218
Interest Rate
7.5%
Mortgage Type
Assumption
Purchase Details
Closed on
Jul 31, 1987
Create a Home Valuation Report for This Property
The Home Valuation Report is an in-depth analysis detailing your home's value as well as a comparison with similar homes in the area
Home Values in the Area
Average Home Value in this Area
Purchase History
| Date | Buyer | Sale Price | Title Company |
|---|---|---|---|
| Nino And Candace Bautista Family Trust | -- | None Listed On Document | |
| Bautista Nino A | $166,000 | Commonwealth Land Title | |
| -- | $125,900 | -- |
Source: Public Records
Mortgage History
| Date | Status | Borrower | Loan Amount |
|---|---|---|---|
| Previous Owner | Bautista Nino A | $169,218 |
Source: Public Records
Tax History
| Year | Tax Paid | Tax Assessment Tax Assessment Total Assessment is a certain percentage of the fair market value that is determined by local assessors to be the total taxable value of land and additions on the property. | Land | Improvement |
|---|---|---|---|---|
| 2025 | $1,321 | $275,570 | $86,197 | $189,373 |
| 2024 | $1,321 | $270,167 | $84,507 | $185,660 |
| 2023 | $3,017 | $264,870 | $82,850 | $182,020 |
| 2022 | $3,008 | $259,677 | $81,226 | $178,451 |
| 2021 | $2,944 | $254,586 | $79,634 | $174,952 |
| 2020 | $2,934 | $251,977 | $78,818 | $173,159 |
| 2019 | $2,893 | $247,037 | $77,273 | $169,764 |
| 2018 | $2,758 | $242,194 | $75,758 | $166,436 |
| 2017 | $70 | $237,446 | $74,273 | $163,173 |
| 2016 | $2,647 | $232,791 | $72,817 | $159,974 |
| 2015 | $2,637 | $229,296 | $71,724 | $157,572 |
| 2014 | $2,575 | $224,806 | $70,320 | $154,486 |
Source: Public Records
Map
Nearby Homes
- 5259 Hubbert St
- 1513 Powell Rd
- 1162 Sagewood Dr
- 1288 Sagewood Dr
- 1704 Laurelwood Way
- 5216 Palmera Dr
- 5177 Loma Verde
- 1247 Sunglow Dr
- 1690 Bronco Way
- 1351 Cottonwood Dr
- 5103 Mandarin Dr
- 1684 Charlie Horse Way
- 1681 Charlie Horse Way
- 1852 Red Willow Way
- 241 Richard Ct
- 475 Taylor Dr
- 872 Oro Grande St
- 5517 Old Ranch Rd Unit 29
- 1376 Darwin Dr
- 1413 Eastview Ct
- 5275 Hubbert St
- 5267 Hubbert St
- 5279 Hubbert St
- 5263 Hubbert St
- 5231 Dixon Rd
- 1504 Saran Ct
- 5272 Hubbert St
- 1503 Saran Ct
- 5276 Hubbert St
- 5260 Hubbert St
- 5235 Dixon Rd
- 1508 Saran Ct
- 5280 Hubbert St
- 1512 Saran Ct
- 1450 Henshaw Rd
- 1507 Saran Ct
- 5239 Dixon Rd
- 5256 Hubbert St
- 1516 Saran Ct
- 1446 Henshaw Rd
Your Personal Tour Guide
Ask me questions while you tour the home.