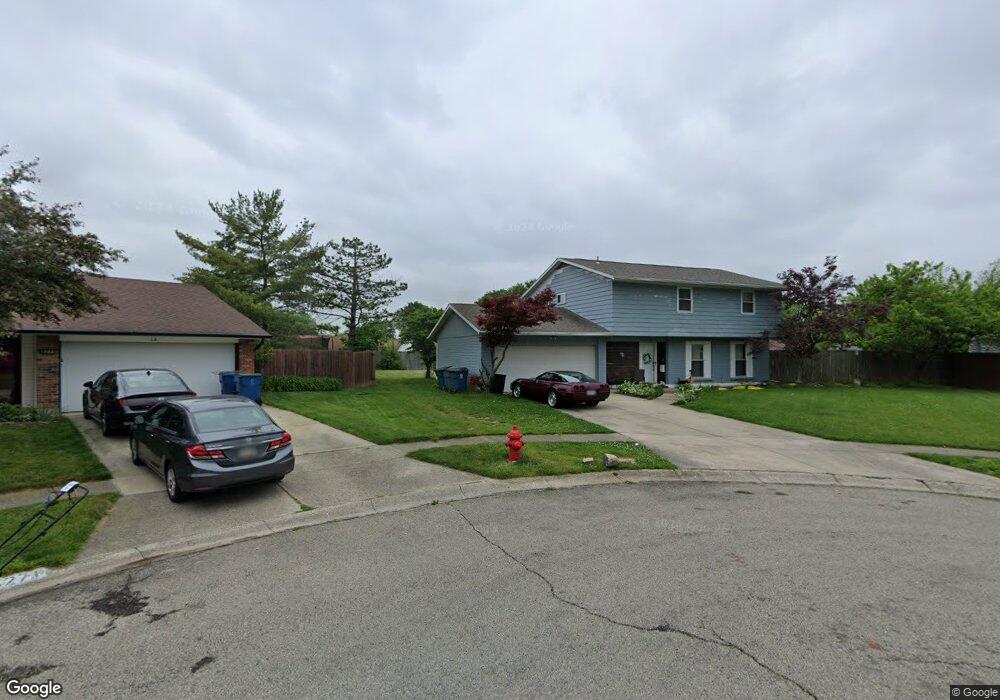
5272 Robinview Ct Dayton, OH 45424
Estimated Value: $252,000 - $276,950
4
Beds
3
Baths
2,091
Sq Ft
$126/Sq Ft
Est. Value
About This Home
This home is located at 5272 Robinview Ct, Dayton, OH 45424 and is currently estimated at $263,988, approximately $126 per square foot. 5272 Robinview Ct is a home located in Montgomery County with nearby schools including Wayne High School and Huber Heights Christian Academy.
Ownership History
Date
Name
Owned For
Owner Type
Purchase Details
Closed on
Mar 9, 2015
Sold by
Us Bank Na
Bought by
Lucas Jesse R
Current Estimated Value
Purchase Details
Closed on
Nov 10, 2014
Sold by
Murphy Jeffrey and Murphy Jeffrey D
Bought by
Us Bank Na
Purchase Details
Closed on
Oct 26, 2005
Sold by
Smith Randall A and Smith Marie M
Bought by
Murphy Jeffrey
Home Financials for this Owner
Home Financials are based on the most recent Mortgage that was taken out on this home.
Original Mortgage
$114,400
Interest Rate
8.3%
Mortgage Type
Fannie Mae Freddie Mac
Purchase Details
Closed on
Sep 24, 1999
Sold by
Sullivan Mark J and Sullivan Linda M
Bought by
Smith Randall A
Home Financials for this Owner
Home Financials are based on the most recent Mortgage that was taken out on this home.
Original Mortgage
$136,824
Interest Rate
7.93%
Mortgage Type
FHA
Create a Home Valuation Report for This Property
The Home Valuation Report is an in-depth analysis detailing your home's value as well as a comparison with similar homes in the area
Home Values in the Area
Average Home Value in this Area
Purchase History
| Date | Buyer | Sale Price | Title Company |
|---|---|---|---|
| Lucas Jesse R | $74,494 | None Available | |
| Us Bank Na | $74,000 | None Available | |
| Murphy Jeffrey | $143,000 | -- | |
| Smith Randall A | $136,900 | -- |
Source: Public Records
Mortgage History
| Date | Status | Borrower | Loan Amount |
|---|---|---|---|
| Previous Owner | Murphy Jeffrey | $114,400 | |
| Previous Owner | Smith Randall A | $136,824 |
Source: Public Records
Tax History
| Year | Tax Paid | Tax Assessment Tax Assessment Total Assessment is a certain percentage of the fair market value that is determined by local assessors to be the total taxable value of land and additions on the property. | Land | Improvement |
|---|---|---|---|---|
| 2025 | $4,186 | $78,790 | $12,340 | $66,450 |
| 2024 | $4,043 | $78,790 | $12,340 | $66,450 |
| 2023 | $4,043 | $78,790 | $12,340 | $66,450 |
| 2022 | $3,647 | $55,910 | $8,750 | $47,160 |
| 2021 | $3,689 | $55,910 | $8,750 | $47,160 |
| 2020 | $3,692 | $55,910 | $8,750 | $47,160 |
| 2019 | $3,361 | $44,960 | $8,750 | $36,210 |
| 2018 | $3,372 | $44,960 | $8,750 | $36,210 |
| 2017 | $3,349 | $44,960 | $8,750 | $36,210 |
| 2016 | $3,271 | $42,830 | $8,750 | $34,080 |
| 2015 | $3,698 | $42,830 | $8,750 | $34,080 |
| 2014 | $3,698 | $42,830 | $8,750 | $34,080 |
| 2012 | -- | $42,960 | $9,630 | $33,330 |
Source: Public Records
Map
Nearby Homes
- 7049 Pineview Dr
- 5873 Troy Villa Blvd Unit 20174
- 4942 Birchview Ct
- 5260 Beechview Dr
- 5667 Troy Villa Blvd Unit 20081
- 7259 Charnwood Dr
- 5934 Troy Villa Blvd Unit 20066
- 7535 Mount Hood Unit 12015
- 6686 Oakwood Ln
- 6750 Tiger Dr
- 6724 Willow Creek Dr
- 6805 Willow Creek Dr
- 4821 Meadowvista Dr
- 5907 Beech Ct
- 2254 Kiel St
- 2251 Kiel St
- 6388 Stoney Creek Dr
- 4785 Belmont Place
- 6224 Cruxten Dr
- 7773 Timbercrest Dr
- 5266 Robinview Ct
- 7133 Pineview Dr
- 5271 Robinview Ct
- 7143 Pineview Dr
- 7113 Pineview Dr
- 7083 Pineview Dr
- 7093 Pineview Dr
- 5260 Robinview Ct
- 7061 Pineview Dr
- 7149 Pineview Dr
- 5265 Robinview Ct
- 5259 Robinview Ct
- 7057 Pineview Dr
- 7159 Pineview Dr
- 5254 Robinview Ct
- 7136 Pineview Dr
- 7144 Pineview Dr
- 5200 Pathview Dr
- 5170 Pathview Dr
- 5253 Robinview Ct
Your Personal Tour Guide
Ask me questions while you tour the home.