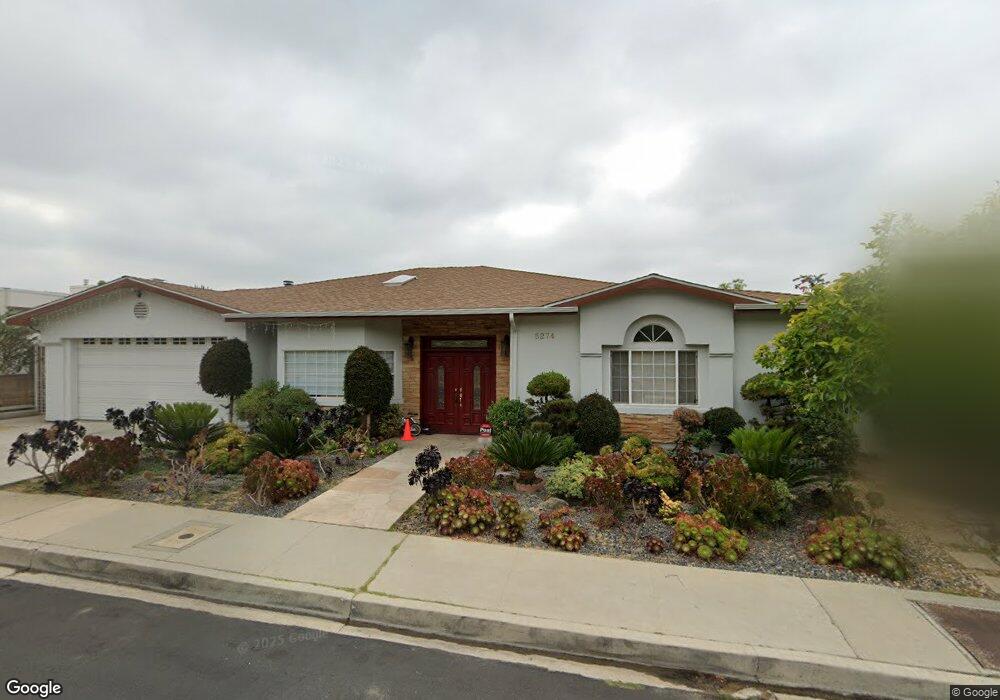
5274 Los Caballeros Way Los Angeles, CA 90027
Los Feliz NeighborhoodEstimated Value: $2,367,000 - $3,511,000
4
Beds
4
Baths
3,073
Sq Ft
$964/Sq Ft
Est. Value
About This Home
This home is located at 5274 Los Caballeros Way, Los Angeles, CA 90027 and is currently estimated at $2,962,145, approximately $963 per square foot. 5274 Los Caballeros Way is a home located in Los Angeles County with nearby schools including Los Feliz STEMM Magnet, Thomas Starr King Middle School Film and Media Magnet, and John Marshall Senior High.
Ownership History
Date
Name
Owned For
Owner Type
Purchase Details
Closed on
Feb 22, 2002
Sold by
Son Eun B
Bought by
Choi Jong Won
Current Estimated Value
Purchase Details
Closed on
Jun 1, 2001
Sold by
Sohn Un Ae
Bought by
Son Eun B
Purchase Details
Closed on
Mar 20, 2001
Sold by
Son Eun B
Bought by
Sohn Un Ae
Purchase Details
Closed on
Nov 20, 1998
Sold by
Son Eun Joo Jun
Bought by
Son Eun B
Home Financials for this Owner
Home Financials are based on the most recent Mortgage that was taken out on this home.
Original Mortgage
$500,000
Interest Rate
2.95%
Purchase Details
Closed on
Jan 31, 1997
Sold by
Southern California Fsla
Bought by
Son Eun Bean
Home Financials for this Owner
Home Financials are based on the most recent Mortgage that was taken out on this home.
Original Mortgage
$364,700
Interest Rate
7.81%
Purchase Details
Closed on
Sep 19, 1996
Sold by
Ahn Young Jay and Ahn Yung Soon
Bought by
Southern California Fsla
Create a Home Valuation Report for This Property
The Home Valuation Report is an in-depth analysis detailing your home's value as well as a comparison with similar homes in the area
Home Values in the Area
Average Home Value in this Area
Purchase History
| Date | Buyer | Sale Price | Title Company |
|---|---|---|---|
| Choi Jong Won | $830,000 | American Title Co | |
| Son Eun B | -- | Gateway Title Company | |
| Sohn Un Ae | -- | Chicago Title | |
| Son Eun B | -- | Gateway Title Company | |
| Son Eun Bean | $405,500 | First American Title | |
| Southern California Fsla | $487,500 | First American Title Co |
Source: Public Records
Mortgage History
| Date | Status | Borrower | Loan Amount |
|---|---|---|---|
| Previous Owner | Son Eun B | $500,000 | |
| Previous Owner | Son Eun Bean | $364,700 |
Source: Public Records
Tax History Compared to Growth
Tax History
| Year | Tax Paid | Tax Assessment Tax Assessment Total Assessment is a certain percentage of the fair market value that is determined by local assessors to be the total taxable value of land and additions on the property. | Land | Improvement |
|---|---|---|---|---|
| 2025 | $14,902 | $1,226,140 | $922,714 | $303,426 |
| 2024 | $14,902 | $1,202,099 | $904,622 | $297,477 |
| 2023 | $14,616 | $1,178,530 | $886,885 | $291,645 |
| 2022 | $13,942 | $1,155,423 | $869,496 | $285,927 |
| 2021 | $13,764 | $1,132,769 | $852,448 | $280,321 |
| 2019 | $13,354 | $1,099,172 | $827,165 | $272,007 |
| 2018 | $13,191 | $1,077,621 | $810,947 | $266,674 |
| 2016 | $12,598 | $1,035,778 | $779,458 | $256,320 |
| 2015 | $12,414 | $1,020,220 | $767,750 | $252,470 |
| 2014 | $12,454 | $1,000,236 | $752,711 | $247,525 |
Source: Public Records
Map
Nearby Homes
- 5284 Los Diegos Way
- 2103 N Hobart Blvd
- 2177 Fern Dell Place
- 5222 Los Franciscos Way
- 2244 E Live Oak Dr
- 2027 Laughlin Park Dr
- 2188 Ponet Dr
- 5136 Los Bonitos Way
- 5432 Red Oak Dr
- 2401 Nottingham Ave
- 2417 Nottingham Ave
- 2267 Winona Blvd
- 5470 Los Feliz Blvd
- 2341 N Hobart Blvd
- 5107 Los Hermosos Way
- 2252 Verde Oak Dr
- 5163 Franklin Ave
- 1901 N Oxford Ave
- 5630 Valley Oak Dr
- 1982 N Normandie Ave
- 5266 Los Caballeros Way
- 5282 Los Caballeros Way
- 5258 Los Caballeros Way
- 5288 Los Caballeros Way
- 5278 Los Diegos Way
- 5264 Los Bonitos Way
- 5270 Los Diegos Way
- 5256 Los Bonitos Way
- 5248 Los Caballeros Way
- 5262 Los Diegos Way
- 5286 Los Bonitos Way
- 5250 Los Bonitos Way
- 5254 Los Diegos Way
- 5240 Los Caballeros Way
- 2151 N Hobart Blvd
- 2143 N Hobart Blvd
- 5242 Los Bonitos Way
- 5246 Los Diegos Way
- 5264 Los Adornos Way
- 2159 N Hobart Blvd