Estimated Value: $87,000 - $180,000
2
Beds
1
Bath
915
Sq Ft
$135/Sq Ft
Est. Value
About This Home
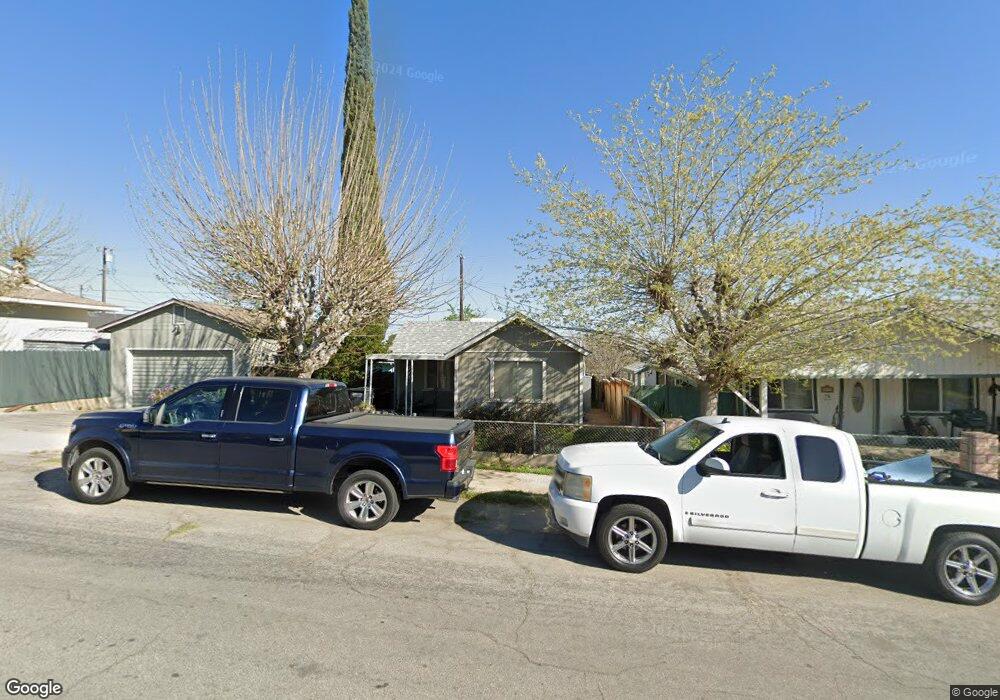
This home is located at 528 E St, Taft, CA 93268 and is currently estimated at $123,341, approximately $134 per square foot. 528 E St is a home located in Kern County with nearby schools including Parkview Elementary School, Roosevelt Elementary School, and Lincoln Junior High School.
Ownership History
Date
Name
Owned For
Owner Type
Purchase Details
Closed on
Oct 20, 2025
Sold by
Vaughn Family Trust and Vaughn Fred D
Bought by
G & G Capital Group Inc
Current Estimated Value
Home Financials for this Owner
Home Financials are based on the most recent Mortgage that was taken out on this home.
Original Mortgage
$132,500
Outstanding Balance
$132,500
Interest Rate
6.35%
Mortgage Type
New Conventional
Estimated Equity
-$9,159
Purchase Details
Closed on
Aug 20, 2024
Sold by
Vaughn Fred D
Bought by
Vaughn Family Trust and Vaughn
Create a Home Valuation Report for This Property
The Home Valuation Report is an in-depth analysis detailing your home's value as well as a comparison with similar homes in the area
Home Values in the Area
Average Home Value in this Area
Purchase History
| Date | Buyer | Sale Price | Title Company |
|---|---|---|---|
| G & G Capital Group Inc | $88,000 | Ticor Title Company | |
| Vaughn Family Trust | -- | None Listed On Document |
Source: Public Records
Mortgage History
| Date | Status | Borrower | Loan Amount |
|---|---|---|---|
| Open | G & G Capital Group Inc | $132,500 |
Source: Public Records
Tax History
| Year | Tax Paid | Tax Assessment Tax Assessment Total Assessment is a certain percentage of the fair market value that is determined by local assessors to be the total taxable value of land and additions on the property. | Land | Improvement |
|---|---|---|---|---|
| 2025 | $2,200 | $87,803 | $23,396 | $64,407 |
| 2024 | $2,200 | $86,083 | $22,938 | $63,145 |
| 2023 | $1,987 | $84,396 | $22,489 | $61,907 |
| 2022 | $1,808 | $82,743 | $22,049 | $60,694 |
| 2021 | $1,715 | $81,121 | $21,617 | $59,504 |
| 2020 | $1,590 | $80,290 | $21,396 | $58,894 |
| 2019 | $1,556 | $80,290 | $21,396 | $58,894 |
| 2018 | $1,182 | $50,000 | $13,000 | $37,000 |
| 2017 | $1,228 | $55,000 | $14,000 | $41,000 |
| 2016 | $1,186 | $51,000 | $12,000 | $39,000 |
| 2015 | $1,329 | $70,000 | $15,000 | $55,000 |
| 2014 | $1,137 | $58,000 | $15,000 | $43,000 |
Source: Public Records
Map
Nearby Homes
Your Personal Tour Guide
Ask me questions while you tour the home.