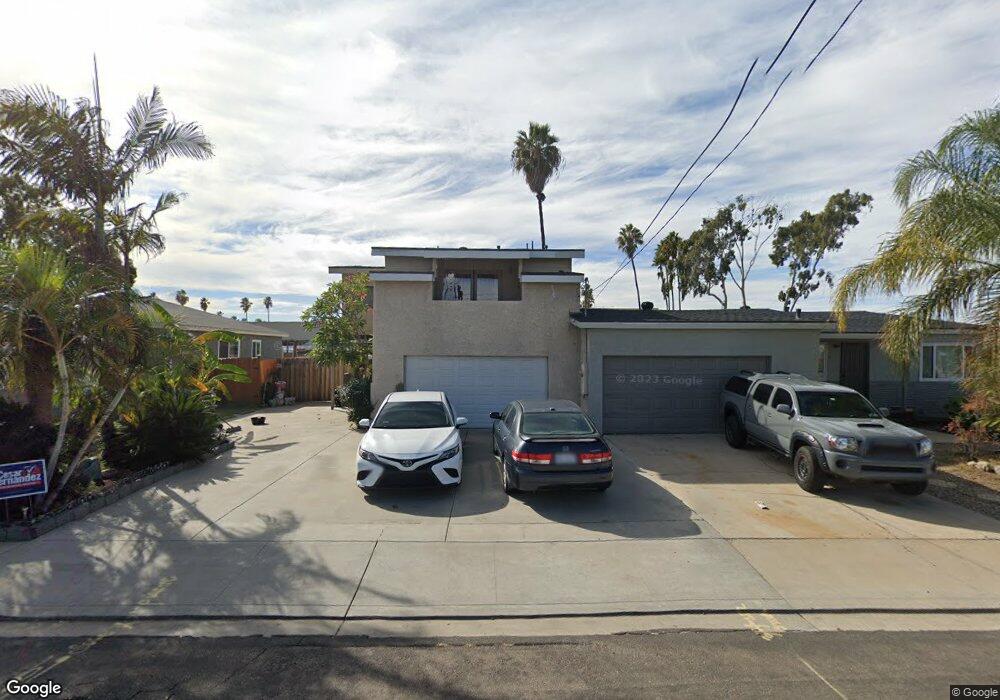
528 Fig Ave Chula Vista, CA 91910
Downtown Chula Vista NeighborhoodEstimated Value: $1,020,000 - $1,231,013
6
Beds
5
Baths
3,474
Sq Ft
$316/Sq Ft
Est. Value
About This Home
This home is located at 528 Fig Ave, Chula Vista, CA 91910 and is currently estimated at $1,099,253, approximately $316 per square foot. 528 Fig Ave is a home located in San Diego County with nearby schools including Vista Square Elementary School, Chula Vista Middle School, and Chula Vista High School.
Ownership History
Date
Name
Owned For
Owner Type
Purchase Details
Closed on
Dec 27, 2022
Sold by
Steven M Kennedy 2021 Trust and Shadoan Crystal
Bought by
Steven M Kennedy 2022 Trust and Zamora
Current Estimated Value
Purchase Details
Closed on
Dec 27, 2021
Sold by
Kennedy Steven M
Bought by
Shadoan Crystal and The Steven M Kennedy 2021 Trust
Purchase Details
Closed on
May 21, 1998
Sold by
Gates Diane M
Bought by
Gates Diane M and Kennedy Steven M
Purchase Details
Closed on
Sep 30, 1993
Sold by
Gates Diane M and Kennedy Steven M
Bought by
Gates Diane M
Create a Home Valuation Report for This Property
The Home Valuation Report is an in-depth analysis detailing your home's value as well as a comparison with similar homes in the area
Home Values in the Area
Average Home Value in this Area
Purchase History
| Date | Buyer | Sale Price | Title Company |
|---|---|---|---|
| Steven M Kennedy 2022 Trust | -- | None Listed On Document | |
| Shadoan Crystal | -- | None Available | |
| Gates Diane M | -- | -- | |
| Gates Diane M | -- | -- |
Source: Public Records
Tax History Compared to Growth
Tax History
| Year | Tax Paid | Tax Assessment Tax Assessment Total Assessment is a certain percentage of the fair market value that is determined by local assessors to be the total taxable value of land and additions on the property. | Land | Improvement |
|---|---|---|---|---|
| 2025 | $3,589 | $317,376 | $33,007 | $284,369 |
| 2024 | $3,589 | $311,154 | $32,360 | $278,794 |
| 2023 | $3,621 | $305,054 | $31,726 | $273,328 |
| 2022 | $3,436 | $299,073 | $31,104 | $267,969 |
| 2021 | $3,355 | $293,210 | $30,495 | $262,715 |
| 2020 | $3,274 | $290,205 | $30,183 | $260,022 |
| 2019 | $3,188 | $284,516 | $29,592 | $254,924 |
| 2018 | $3,138 | $278,938 | $29,012 | $249,926 |
| 2017 | $10 | $273,470 | $28,444 | $245,026 |
| 2016 | $2,997 | $268,109 | $27,887 | $240,222 |
| 2015 | $2,954 | $264,083 | $27,469 | $236,614 |
| 2014 | $2,904 | $258,911 | $26,931 | $231,980 |
Source: Public Records
Map
Nearby Homes
- Plan 6 at Citrus Bay - The Towns
- Plan 4 at Citrus Bay - The Towns
- Plan 2 at Citrus Bay - The Towns
- Plan 5 at Citrus Bay - The Towns
- Plan 3 at Citrus Bay - The Towns
- Plan 1 at Citrus Bay - The Towns
- Plan1 at Citrus Bay - The Courts
- Plan 2 at Citrus Bay - The Courts
- Plan 3 at Citrus Bay - The Courts
- 490 Fourth Ave Unit 21
- 580 4th Ave
- 383 Mankato St Unit 6
- 475 4th Ave Unit H
- 471 4th Ave Unit B
- 465 Fourth Ave Unit 17
- 465 Fourth Ave Unit 14
- 658 Cedar Ave
- 536 Park Way Unit 41,42
- 622 I St
- 376 Center St Unit 304