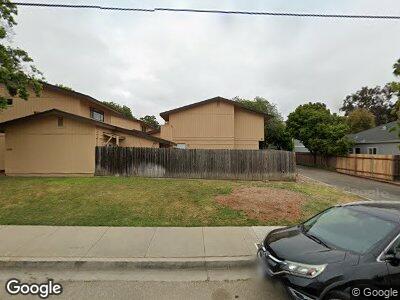
528 Hathway Ave Unit D San Luis Obispo, CA 93405
Santa Rosa NeighborhoodEstimated Value: $686,000 - $827,000
2
Beds
2
Baths
1,200
Sq Ft
$624/Sq Ft
Est. Value
About This Home
This home is located at 528 Hathway Ave Unit D, San Luis Obispo, CA 93405 and is currently estimated at $748,673, approximately $623 per square foot. 528 Hathway Ave Unit D is a home located in San Luis Obispo County with nearby schools including Bishop's Peak Elementary School, Laguna Middle School, and San Luis Obispo High School.
Ownership History
Date
Name
Owned For
Owner Type
Purchase Details
Closed on
Oct 8, 2010
Sold by
Mcginnis Michael R and Mcginnis Robert R
Bought by
Mcginnis Michael Robert and Mcginnis Roberta Rae
Current Estimated Value
Purchase Details
Closed on
Apr 18, 2001
Sold by
Karnes Steven D and Karnes Mary Ann
Bought by
Mcginnis Michael R and Mcginnis Roberta R
Home Financials for this Owner
Home Financials are based on the most recent Mortgage that was taken out on this home.
Original Mortgage
$187,200
Interest Rate
6.89%
Purchase Details
Closed on
Oct 3, 2000
Sold by
Karnes Steven and Karnes Mary Ann
Bought by
Karnes Steven D and Karnes Mary Ann
Purchase Details
Closed on
Feb 26, 1999
Sold by
Seifoddini Hamid and Seifoddini Minoo
Bought by
Karnes Steve and Karnes Mary Ann
Home Financials for this Owner
Home Financials are based on the most recent Mortgage that was taken out on this home.
Original Mortgage
$136,800
Interest Rate
6.73%
Create a Home Valuation Report for This Property
The Home Valuation Report is an in-depth analysis detailing your home's value as well as a comparison with similar homes in the area
Home Values in the Area
Average Home Value in this Area
Purchase History
| Date | Buyer | Sale Price | Title Company |
|---|---|---|---|
| Mcginnis Michael Robert | -- | First American Title Company | |
| Mcginnis Michael R | $234,000 | First American Title | |
| Karnes Steven D | -- | -- | |
| Karnes Steve | $152,000 | Cuesta Title Company |
Source: Public Records
Mortgage History
| Date | Status | Borrower | Loan Amount |
|---|---|---|---|
| Open | Mcginnis Michael Robert | $225,000 | |
| Closed | Mcginnis Michael Robert | $175,000 | |
| Closed | Mcginnis Michael R | $123,600 | |
| Closed | Mcginnis Michael R | $187,200 | |
| Closed | Mcginnis Michael R | $187,200 | |
| Previous Owner | Karnes Steve | $136,800 |
Source: Public Records
Tax History Compared to Growth
Tax History
| Year | Tax Paid | Tax Assessment Tax Assessment Total Assessment is a certain percentage of the fair market value that is determined by local assessors to be the total taxable value of land and additions on the property. | Land | Improvement |
|---|---|---|---|---|
| 2024 | $3,751 | $345,665 | $162,493 | $183,172 |
| 2023 | $3,751 | $338,888 | $159,307 | $179,581 |
| 2022 | $3,516 | $332,244 | $156,184 | $176,060 |
| 2021 | $3,460 | $325,730 | $153,122 | $172,608 |
| 2020 | $3,425 | $322,391 | $151,552 | $170,839 |
| 2019 | $3,389 | $316,071 | $148,581 | $167,490 |
| 2018 | $3,323 | $309,874 | $145,668 | $164,206 |
| 2017 | $3,257 | $303,799 | $142,812 | $160,987 |
| 2016 | $3,194 | $297,843 | $140,012 | $157,831 |
| 2015 | $3,145 | $293,370 | $137,909 | $155,461 |
| 2014 | $2,888 | $287,624 | $135,208 | $152,416 |
Source: Public Records
Map
Nearby Homes
- 551 Hathway Ave
- 1247 Murray Ave
- 55 Stenner St Unit L
- 55 Stenner St Unit H
- 311 Longview Ln
- 25 Stenner St Unit C
- 1171 Peach St
- 1220 Mill St
- 1185 E Foothill Blvd Unit 17
- 779 Toro St
- 783 Toro St
- 879 Walnut St
- 652 Morro St
- 881 Peach St Unit A
- 810 Meinecke Ave
- 69 Chorro St
- 680 Chorro St Unit 18
- 1339 Higuera St
- 750 Chorro St Unit 5
- 273 Almond St
- 528 Hathway Ave
- 528 Hathway Ave Unit B
- 528 Hathway Ave Unit A
- 528 Hathway Ave
- 528 Hathway Ave
- 528 Hathway Ave Unit F
- 528 Hathway Ave Unit E
- 528 Hathway Ave Unit D
- 528 Hathway Ave Unit C
- 534 Hathway Ave
- 536 Hathway Ave
- 523 Hathway Ave
- 529 Hathway Ave
- 521 Hathway Ave
- 533 Hathway Ave
- 542 Hathway Ave Unit ABC
- 542 Hathway Ave
- 537 Hathway Ave
- 506 Hathway Ave