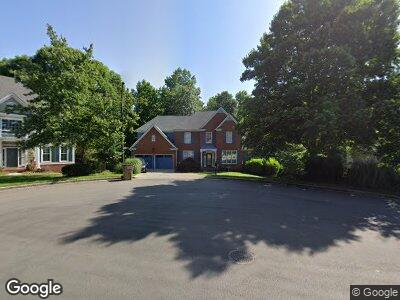
528 Waterside Ct Unit 3E Canton, GA 30114
Sutallee NeighborhoodEstimated Value: $648,850 - $705,000
5
Beds
4
Baths
4,083
Sq Ft
$164/Sq Ft
Est. Value
About This Home
This home is located at 528 Waterside Ct Unit 3E, Canton, GA 30114 and is currently estimated at $671,463, approximately $164 per square foot. 528 Waterside Ct Unit 3E is a home located in Cherokee County with nearby schools including Liberty Elementary School, Freedom Middle School, and Cherokee High School.
Ownership History
Date
Name
Owned For
Owner Type
Purchase Details
Closed on
Mar 5, 2020
Sold by
Mcmahan James A
Bought by
Masterson Daniel and Masterson Trisha
Current Estimated Value
Home Financials for this Owner
Home Financials are based on the most recent Mortgage that was taken out on this home.
Original Mortgage
$354,386
Interest Rate
3.4%
Mortgage Type
VA
Purchase Details
Closed on
Oct 19, 2001
Sold by
Blueridge Residential Inc
Bought by
Mcmahan James A and Mcmahan Karen M
Home Financials for this Owner
Home Financials are based on the most recent Mortgage that was taken out on this home.
Original Mortgage
$75,000
Interest Rate
6.74%
Mortgage Type
New Conventional
Create a Home Valuation Report for This Property
The Home Valuation Report is an in-depth analysis detailing your home's value as well as a comparison with similar homes in the area
Home Values in the Area
Average Home Value in this Area
Purchase History
| Date | Buyer | Sale Price | Title Company |
|---|---|---|---|
| Masterson Daniel | $342,000 | -- | |
| Mcmahan James A | $273,200 | -- |
Source: Public Records
Mortgage History
| Date | Status | Borrower | Loan Amount |
|---|---|---|---|
| Open | Masterson Daniel | $50,000 | |
| Open | Masterson Daniel | $489,150 | |
| Closed | Masterson Daniel | $354,386 | |
| Previous Owner | Mcmahan James A | $233,600 | |
| Previous Owner | Mcmahan James | $73,600 | |
| Previous Owner | Mcmahan James A | $100,000 | |
| Previous Owner | Mcmahan James A | $75,000 |
Source: Public Records
Tax History Compared to Growth
Tax History
| Year | Tax Paid | Tax Assessment Tax Assessment Total Assessment is a certain percentage of the fair market value that is determined by local assessors to be the total taxable value of land and additions on the property. | Land | Improvement |
|---|---|---|---|---|
| 2024 | $5,808 | $223,480 | $46,000 | $177,480 |
| 2023 | $5,641 | $217,080 | $46,000 | $171,080 |
| 2022 | $4,839 | $184,120 | $36,000 | $148,120 |
| 2021 | $3,883 | $136,800 | $25,566 | $111,234 |
| 2020 | $4,105 | $144,480 | $28,800 | $115,680 |
| 2019 | $3,953 | $139,120 | $28,800 | $110,320 |
| 2018 | $3,740 | $130,840 | $27,200 | $103,640 |
| 2017 | $3,498 | $315,900 | $24,480 | $101,880 |
| 2016 | $3,498 | $300,400 | $24,480 | $95,680 |
| 2015 | $3,266 | $277,700 | $21,600 | $89,480 |
| 2014 | $3,179 | $269,800 | $21,600 | $86,320 |
Source: Public Records
Map
Nearby Homes
- 520 Waterside Ct
- 402 Lake Point Trace
- 329 Lakebridge Crossing
- 424 Lake Point Trace
- 1345 Bridge Mill Ave Unit 3D
- 1348 Bridgemill Ave
- 146 Cedar Woods Trail
- 4115 Gold Mill Ridge
- 4113 Gold Mill Ridge
- 147 Gold Bridge Crossing
- 500 Poplar Creek Crossing
- 4126 Gold Mill Ridge
- 3022 Woodbridge Ln
- 3085 Woodbridge Ln
- 303 Gold Bridge Ln
- 2034 Gold Leaf Pkwy
- 103 Gold Springs Ct Unit 4I
- 528 Waterside Ct Unit 3E
- 529 Waterside Ct
- 524 Waterside Ct Unit 3E
- 525 Waterside Ct
- 509 Lakewood Ct
- 507 Lakewood Ct Unit 3J
- 511 Lakewood Ct
- 522 Waterside Ct Unit 3E
- 505 Lakewood Ct
- 0 Lakewood Ct Unit 7375172
- 0 Lakewood Ct Unit 7121537
- 0 Lakewood Ct Unit 7070067
- 0 Lakewood Ct Unit 7000079
- 0 Lakewood Ct Unit 8881749
- 0 Lakewood Ct Unit 8803544
- 0 Lakewood Ct Unit 8641306
- 0 Lakewood Ct Unit 8601689
- 0 Lakewood Ct Unit 8240328
- 0 Lakewood Ct Unit 8226922
- 0 Lakewood Ct Unit 3254164