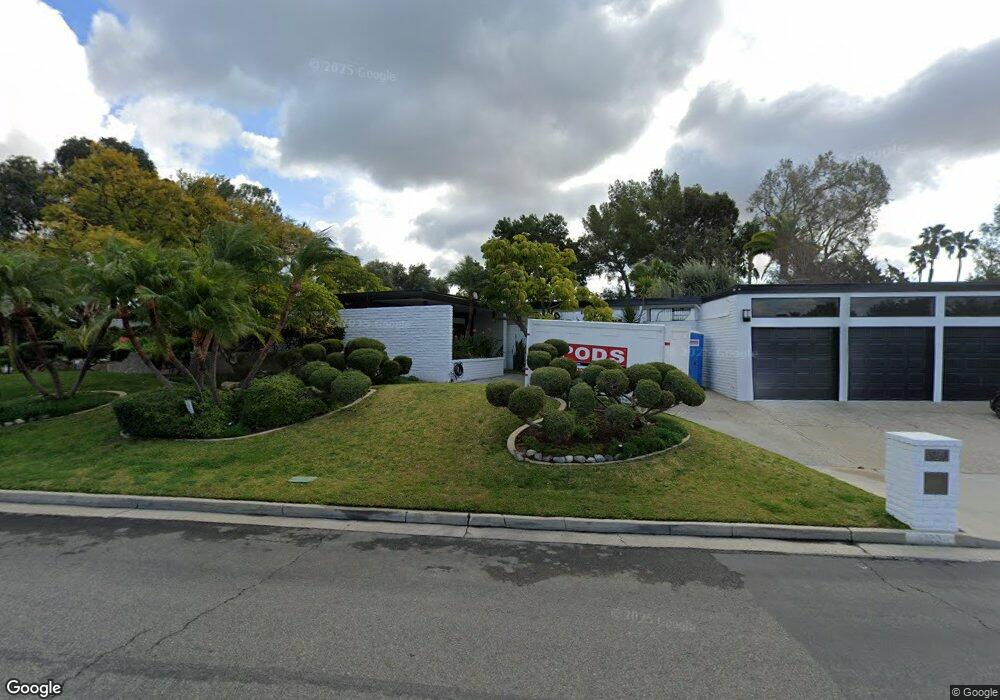
5280 Buck Hill Ave Buena Park, CA 90621
Estimated Value: $2,742,000 - $3,045,218
4
Beds
4
Baths
4,704
Sq Ft
$608/Sq Ft
Est. Value
About This Home
This home is located at 5280 Buck Hill Ave, Buena Park, CA 90621 and is currently estimated at $2,858,555, approximately $607 per square foot. 5280 Buck Hill Ave is a home located in Orange County with nearby schools including Charles G. Emery Elementary School, Buena Park Junior High School, and Sunny Hills High School.
Ownership History
Date
Name
Owned For
Owner Type
Purchase Details
Closed on
Nov 20, 2017
Sold by
Hong Un Pyo
Bought by
Paik Young J
Current Estimated Value
Home Financials for this Owner
Home Financials are based on the most recent Mortgage that was taken out on this home.
Original Mortgage
$665,000
Outstanding Balance
$557,679
Interest Rate
3.88%
Mortgage Type
Commercial
Estimated Equity
$2,300,876
Purchase Details
Closed on
Nov 4, 2006
Sold by
Hong Julie
Bought by
Paik Young J
Home Financials for this Owner
Home Financials are based on the most recent Mortgage that was taken out on this home.
Original Mortgage
$1,406,250
Interest Rate
6.75%
Mortgage Type
New Conventional
Purchase Details
Closed on
Oct 25, 2006
Sold by
Daily Betty M
Bought by
Paik Young J
Home Financials for this Owner
Home Financials are based on the most recent Mortgage that was taken out on this home.
Original Mortgage
$1,406,250
Interest Rate
6.75%
Mortgage Type
New Conventional
Create a Home Valuation Report for This Property
The Home Valuation Report is an in-depth analysis detailing your home's value as well as a comparison with similar homes in the area
Home Values in the Area
Average Home Value in this Area
Purchase History
| Date | Buyer | Sale Price | Title Company |
|---|---|---|---|
| Paik Young J | -- | None Available | |
| Paik Young J | -- | Investors Title Company | |
| Paik Young J | $1,875,000 | Investors Title Company |
Source: Public Records
Mortgage History
| Date | Status | Borrower | Loan Amount |
|---|---|---|---|
| Open | Paik Young J | $665,000 | |
| Previous Owner | Paik Young J | $1,406,250 |
Source: Public Records
Tax History Compared to Growth
Tax History
| Year | Tax Paid | Tax Assessment Tax Assessment Total Assessment is a certain percentage of the fair market value that is determined by local assessors to be the total taxable value of land and additions on the property. | Land | Improvement |
|---|---|---|---|---|
| 2025 | $26,936 | $2,512,101 | $1,693,119 | $818,982 |
| 2024 | $26,936 | $2,462,845 | $1,659,921 | $802,924 |
| 2023 | $26,407 | $2,414,554 | $1,627,373 | $787,181 |
| 2022 | $26,005 | $2,367,210 | $1,595,463 | $771,747 |
| 2021 | $25,822 | $2,320,795 | $1,564,180 | $756,615 |
| 2020 | $25,503 | $2,296,999 | $1,548,142 | $748,857 |
| 2019 | $24,858 | $2,251,960 | $1,517,786 | $734,174 |
| 2018 | $24,368 | $2,207,804 | $1,488,025 | $719,779 |
| 2017 | $24,023 | $2,164,514 | $1,458,848 | $705,666 |
| 2016 | $23,532 | $2,122,073 | $1,430,243 | $691,830 |
| 2015 | $22,475 | $2,090,198 | $1,408,759 | $681,439 |
| 2014 | $22,427 | $2,049,254 | $1,381,163 | $668,091 |
Source: Public Records
Map
Nearby Homes
- 5471 Jonesboro Way
- 8542 Emerywood Dr
- 4900 Lincolnshire Ave
- 5211 Fox Hills Ave
- 6 Tidewater Cove
- 9 Coveside Ct
- 5412 Arrowhead Ave
- 8237 Henshaw Cir
- 8244 Henderson Green
- 86 Lakeside Dr
- 65 Windward Way Unit 23
- 2523 Cypress Point Dr
- 11 Travis Rd
- 4738 Durango Dr
- 5588 Cajon Ave
- 2150 Cheyenne Way Unit 169
- 1617 Via Linda Unit 17
- 2200 Cheyenne Way Unit 117
- 4014 W Commonwealth Ave
- 101 Turner Ave
- 5300 Buck Hill Ave
- 5270 Buck Hill Ave
- 5261 Buck Hill Ave
- 5320 Fairview Ave
- 5310 Buck Hill Ave
- 5260 Buck Hill Ave
- 5310 Fairview Ave
- 5221 Coral Ridge Cir
- 5241 Buck Hill Ave
- 5300 Fairview Ave
- 5240 Buck Hill Ave
- 5320 Buck Hill Ave
- 5320 Buck Hill Place
- 5220 Coral Ridge Cir
- 5290 Fairview Ave
- 5220 Buck Hill Ave
- 5321 Fairview Ave
- 5231 Buck Hill Ave
- 5311 Fairview Ave
- 5340 Buck Hill Place