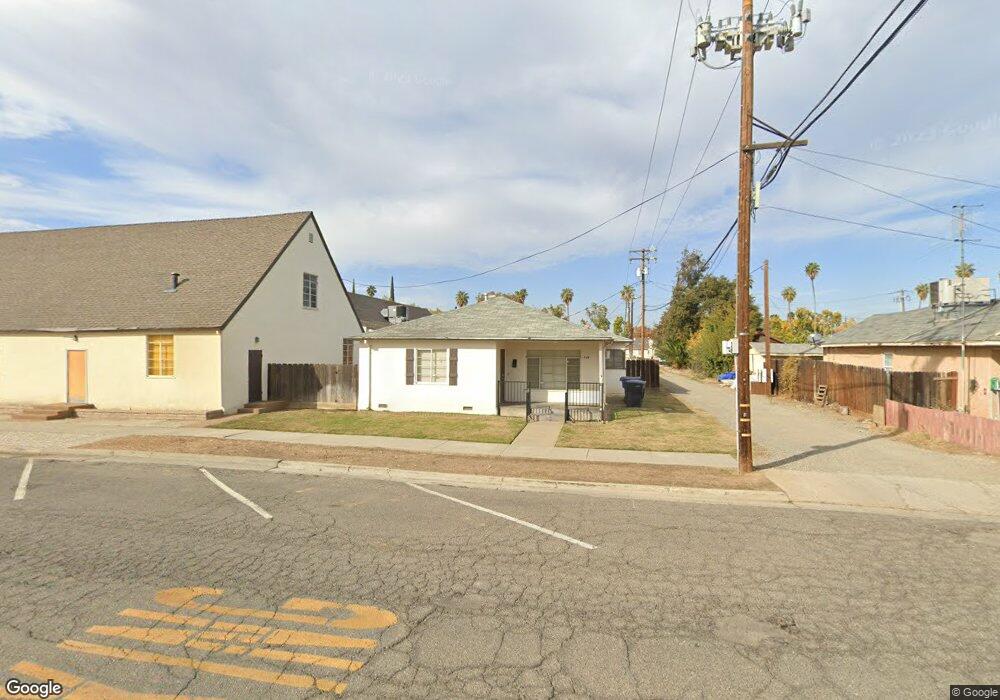
529 F St Patterson, CA 95363
Estimated Value: $304,273 - $321,000
2
Beds
1
Bath
1,048
Sq Ft
$297/Sq Ft
Est. Value
About This Home
This home is located at 529 F St, Patterson, CA 95363 and is currently estimated at $311,068, approximately $296 per square foot. 529 F St is a home located in Stanislaus County with nearby schools including Las Palmas Elementary School, Creekside Middle School, and Patterson High School.
Ownership History
Date
Name
Owned For
Owner Type
Purchase Details
Closed on
Dec 13, 2000
Sold by
Assemblies Of God Northern Ca & Nevada D
Bought by
Family Christian Center Of The Assemblie
Current Estimated Value
Home Financials for this Owner
Home Financials are based on the most recent Mortgage that was taken out on this home.
Original Mortgage
$642,077
Interest Rate
7.24%
Mortgage Type
Seller Take Back
Purchase Details
Closed on
Jul 7, 1997
Sold by
Ch Assembly Of God
Bought by
Assemblies Of God
Create a Home Valuation Report for This Property
The Home Valuation Report is an in-depth analysis detailing your home's value as well as a comparison with similar homes in the area
Home Values in the Area
Average Home Value in this Area
Purchase History
We collect this data history from publicly available records. To have your information removed, we recommend requesting removal directly through your county’s website.
| Date | Buyer | Sale Price | Title Company |
|---|---|---|---|
| Family Christian Center Of The Assemblie | -- | -- | |
| Assemblies Of God | -- | Fidelity National Title |
Source: Public Records
Mortgage History
We collect this data history from publicly available records. To have your information removed, we recommend requesting removal directly through your county’s website.
| Date | Status | Borrower | Loan Amount |
|---|---|---|---|
| Previous Owner | Family Christian Center Of The Assemblie | $642,077 |
Source: Public Records
Tax History
| Year | Tax Paid | Tax Assessment Tax Assessment Total Assessment is a certain percentage of the fair market value that is determined by local assessors to be the total taxable value of land and additions on the property. | Land | Improvement |
|---|---|---|---|---|
| 2025 | $542 | $44,354 | $9,847 | $34,507 |
| 2024 | $540 | $43,485 | $9,654 | $33,831 |
| 2023 | $529 | $42,633 | $9,465 | $33,168 |
| 2022 | $500 | $41,798 | $9,280 | $32,518 |
| 2021 | $493 | $40,980 | $9,099 | $31,881 |
| 2020 | $493 | $40,561 | $9,006 | $31,555 |
| 2019 | $486 | $39,767 | $8,830 | $30,937 |
| 2018 | $464 | $38,988 | $8,657 | $30,331 |
| 2017 | $455 | $38,225 | $8,488 | $29,737 |
| 2016 | $443 | $37,476 | $8,322 | $29,154 |
| 2015 | $436 | $36,914 | $8,197 | $28,717 |
| 2014 | $426 | $36,192 | $8,037 | $28,155 |
Source: Public Records
Map
Nearby Homes
- 855 Toyon Ln
- 201 N 7th St
- 708 Bonneau Ct
- 505 Tuscany Ct
- 850 Miraggio Dr
- 0 Locust Ave
- 601 N 4th St
- 315 M St
- 1132 Marsh Wren Ct
- 1212 Shearwater Dr
- 1126 Gardenia Ct
- 1117 Van Gogh Ln
- 59 Bella Flora Ln
- 1430 Walnut Ave
- 1314 Sutter Creek Ct
- 140 Ivy Ave Unit A5
- 140 Ivy Ave Unit 39
- 941 Arambel Dr
- 301 Orange Blossom Ln
- 608 Somerset Way
Your Personal Tour Guide
Ask me questions while you tour the home.