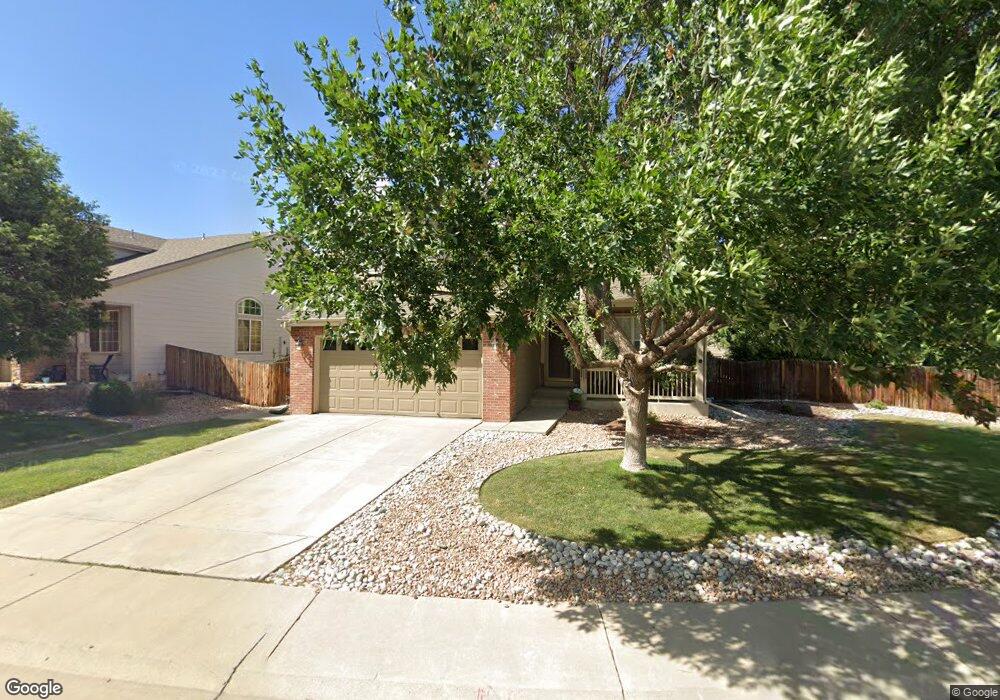
5295 E 116th Place Thornton, CO 80233
Holly Point NeighborhoodEstimated Value: $577,952 - $678,000
4
Beds
4
Baths
3,118
Sq Ft
$202/Sq Ft
Est. Value
About This Home
This home is located at 5295 E 116th Place, Thornton, CO 80233 and is currently estimated at $628,988, approximately $201 per square foot. 5295 E 116th Place is a home located in Adams County with nearby schools including Cherry Drive Elementary School, Shadow Ridge Middle School, and Mountain Range High School.
Ownership History
Date
Name
Owned For
Owner Type
Purchase Details
Closed on
Jun 19, 2009
Sold by
Torres Charles and Torres Deanne
Bought by
Hahn Dustin S and Hahn Jacqueline D
Current Estimated Value
Home Financials for this Owner
Home Financials are based on the most recent Mortgage that was taken out on this home.
Original Mortgage
$242,673
Outstanding Balance
$151,919
Interest Rate
4.84%
Mortgage Type
FHA
Estimated Equity
$477,069
Purchase Details
Closed on
Jul 3, 2001
Sold by
Kdb Homes Inc
Bought by
Torres Charles and Torres Deanne
Home Financials for this Owner
Home Financials are based on the most recent Mortgage that was taken out on this home.
Original Mortgage
$186,900
Interest Rate
7.16%
Create a Home Valuation Report for This Property
The Home Valuation Report is an in-depth analysis detailing your home's value as well as a comparison with similar homes in the area
Home Values in the Area
Average Home Value in this Area
Purchase History
| Date | Buyer | Sale Price | Title Company |
|---|---|---|---|
| Hahn Dustin S | $265,000 | Chicago Title Co | |
| Torres Charles | $233,625 | -- |
Source: Public Records
Mortgage History
| Date | Status | Borrower | Loan Amount |
|---|---|---|---|
| Open | Hahn Dustin S | $242,673 | |
| Previous Owner | Torres Charles | $186,900 |
Source: Public Records
Map
Nearby Homes
- 5141 E 116th Ave
- 11725 Forest Ct
- 5005 E 117th Ave
- 4875 E 117th Dr
- 11465 Cherry Dr
- 11918 Glencoe Dr
- 11368 Forest Dr
- 5243 E 119th Way
- 5211 E 119th Ct
- 4402 E 117th Ct
- 5414 E 113th Ave
- 5080 E 120th Place
- 5063 E 112th Ct
- 11323 Jersey Way
- 11921 Kearney Cir
- 4911 E 112th Place
- 4319 E 118th Ave
- 12099 Forest St
- 5241 E 111th Ct
- 11731 Ash St
- 5265 E 116th Place
- 5290 E 117th Ave
- 5260 E 117th Ave
- 5286 E 116th Place
- 5266 E 116th Place
- 11664 Glencoe St
- 5230 E 117th Ave
- 5256 E 116th Place
- 5300 E 117th Ave
- 5296 E 116th Place
- 11650 Glencoe St
- 5226 E 116th Place
- 5210 E 117th Ave
- 5195 E 116th Place
- 5320 E 117th Ave
- 5295 E 117th Ave
- 5255 E 117th Ave
- 5196 E 116th Place
- 11706 Glencoe St
- 5215 E 117th Ave
Your Personal Tour Guide
Ask me questions while you tour the home.