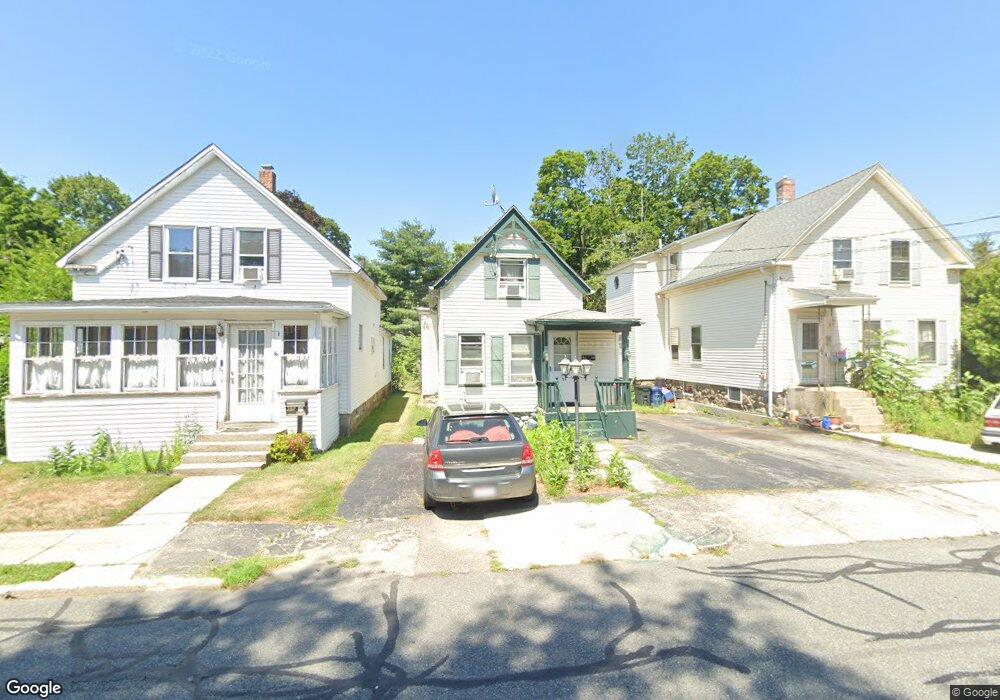
53 1/2 Grove St Unit 1 Milford, MA 01757
Estimated Value: $334,089 - $383,000
3
Beds
1
Bath
940
Sq Ft
$379/Sq Ft
Est. Value
About This Home
This home is located at 53 1/2 Grove St Unit 1, Milford, MA 01757 and is currently estimated at $356,022, approximately $378 per square foot. 53 1/2 Grove St Unit 1 is a home located in Worcester County with nearby schools including Milford High School and Bethany Christian Academy.
Ownership History
Date
Name
Owned For
Owner Type
Purchase Details
Closed on
Jan 7, 2025
Sold by
Gutierrez Saddam J
Bought by
Castanos Mildred A
Current Estimated Value
Purchase Details
Closed on
Dec 24, 2008
Sold by
Citimortgage Inc
Bought by
Dumont John and Dumont Lori-Ann
Purchase Details
Closed on
Apr 8, 2008
Sold by
Boone Daniel R
Bought by
Citimortgage Inc
Create a Home Valuation Report for This Property
The Home Valuation Report is an in-depth analysis detailing your home's value as well as a comparison with similar homes in the area
Home Values in the Area
Average Home Value in this Area
Purchase History
| Date | Buyer | Sale Price | Title Company |
|---|---|---|---|
| Castanos Mildred A | -- | None Available | |
| Castanos Mildred A | -- | None Available | |
| Dumont John | $82,400 | -- | |
| Dumont John | $82,400 | -- | |
| Citimortgage Inc | $30,000 | -- | |
| Citimortgage Inc | $30,000 | -- | |
| Dumont John | $82,400 | -- | |
| Citimortgage Inc | $30,000 | -- |
Source: Public Records
Mortgage History
| Date | Status | Borrower | Loan Amount |
|---|---|---|---|
| Previous Owner | Citimortgage Inc | $75,000 |
Source: Public Records
Tax History Compared to Growth
Tax History
| Year | Tax Paid | Tax Assessment Tax Assessment Total Assessment is a certain percentage of the fair market value that is determined by local assessors to be the total taxable value of land and additions on the property. | Land | Improvement |
|---|---|---|---|---|
| 2025 | $3,651 | $285,200 | $147,900 | $137,300 |
| 2024 | $3,584 | $269,700 | $141,100 | $128,600 |
| 2023 | $3,452 | $238,900 | $118,700 | $120,200 |
| 2022 | $3,381 | $219,700 | $108,400 | $111,300 |
| 2021 | $3,209 | $200,800 | $108,400 | $92,400 |
| 2020 | $2,811 | $176,100 | $108,400 | $67,700 |
| 2019 | $2,709 | $163,800 | $108,400 | $55,400 |
| 2018 | $2,626 | $158,600 | $103,200 | $55,400 |
| 2017 | $2,534 | $150,900 | $103,200 | $47,700 |
| 2016 | $2,366 | $137,700 | $92,900 | $44,800 |
| 2015 | $2,422 | $138,000 | $89,500 | $48,500 |
Source: Public Records
Map
Nearby Homes