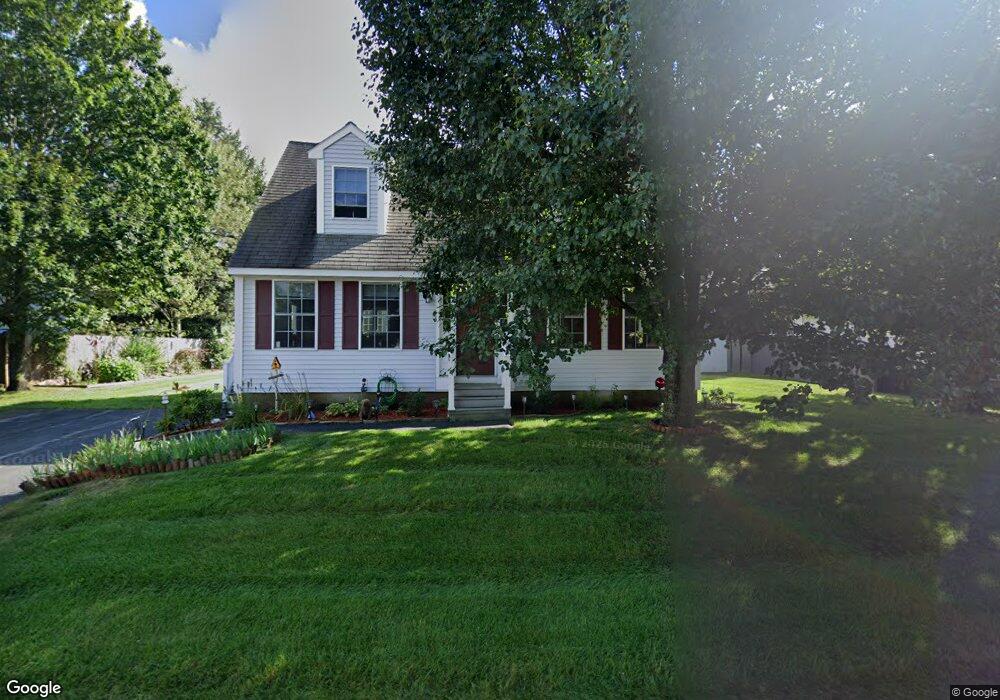
53 Als Ave Allenstown, NH 03275
Suncook NeighborhoodEstimated Value: $422,000 - $459,219
3
Beds
2
Baths
1,547
Sq Ft
$282/Sq Ft
Est. Value
About This Home
This home is located at 53 Als Ave, Allenstown, NH 03275 and is currently estimated at $436,805, approximately $282 per square foot. 53 Als Ave is a home located in Merrimack County with nearby schools including Allenstown Elementary School, Armand R. Dupont School, and Tender Years Child Care & Learning Center.
Ownership History
Date
Name
Owned For
Owner Type
Purchase Details
Closed on
Feb 3, 2015
Sold by
Catara Joy N
Bought by
Joy N Catara Ret and Cantara
Current Estimated Value
Purchase Details
Closed on
Jul 21, 2011
Sold by
Fhlmc
Bought by
Cantara Joy
Home Financials for this Owner
Home Financials are based on the most recent Mortgage that was taken out on this home.
Original Mortgage
$119,000
Interest Rate
4.49%
Mortgage Type
Purchase Money Mortgage
Purchase Details
Closed on
Jul 8, 2011
Sold by
Perdikes Theresa L and Perdikes Fhlmc
Bought by
Fhlmc
Home Financials for this Owner
Home Financials are based on the most recent Mortgage that was taken out on this home.
Original Mortgage
$119,000
Interest Rate
4.49%
Mortgage Type
Purchase Money Mortgage
Create a Home Valuation Report for This Property
The Home Valuation Report is an in-depth analysis detailing your home's value as well as a comparison with similar homes in the area
Home Values in the Area
Average Home Value in this Area
Purchase History
| Date | Buyer | Sale Price | Title Company |
|---|---|---|---|
| Joy N Catara Ret | -- | -- | |
| Cantara Joy | $85,000 | -- | |
| Fhlmc | $158,900 | -- |
Source: Public Records
Mortgage History
| Date | Status | Borrower | Loan Amount |
|---|---|---|---|
| Previous Owner | Fhlmc | $123,200 | |
| Previous Owner | Fhlmc | $119,000 |
Source: Public Records
Tax History Compared to Growth
Tax History
| Year | Tax Paid | Tax Assessment Tax Assessment Total Assessment is a certain percentage of the fair market value that is determined by local assessors to be the total taxable value of land and additions on the property. | Land | Improvement |
|---|---|---|---|---|
| 2024 | $9,212 | $362,400 | $137,900 | $224,500 |
| 2023 | $7,683 | $362,400 | $137,900 | $224,500 |
| 2022 | $7,067 | $362,400 | $137,900 | $224,500 |
| 2021 | $6,587 | $209,100 | $78,400 | $130,700 |
| 2020 | $6,127 | $209,100 | $78,400 | $130,700 |
| 2019 | $6,503 | $209,100 | $78,400 | $130,700 |
| 2018 | $6,304 | $209,100 | $78,400 | $130,700 |
| 2017 | $6,672 | $207,800 | $78,400 | $129,400 |
| 2016 | $5,926 | $175,000 | $57,000 | $118,000 |
| 2015 | $5,745 | $175,000 | $57,000 | $118,000 |
| 2014 | $5,493 | $162,600 | $57,000 | $105,600 |
| 2013 | $5,127 | $162,600 | $57,000 | $105,600 |
Source: Public Records
Map
Nearby Homes
- 422 Dawn Dr Unit 23
- 427 Dawn Dr Unit 15
- 15 Main St
- 4 Rodger Rd
- 1 1/2 Bartlett St
- 7 Ferry St
- 111 Glass St
- 19 Sullivan Dr
- 100 Main St Unit M10
- 100 Main St Unit 204
- 12-14 Church St Unit 12,14
- 10 Lane Dr
- 2 Cheryl Dr
- 15 Sullivan Dr
- 1821 Hooksett Rd
- 307 Dearborn Rd
- 233 Pembroke St
- 259 Pembroke St
- 14 Manor Dr Unit D
- 12 Manor Dr Unit B