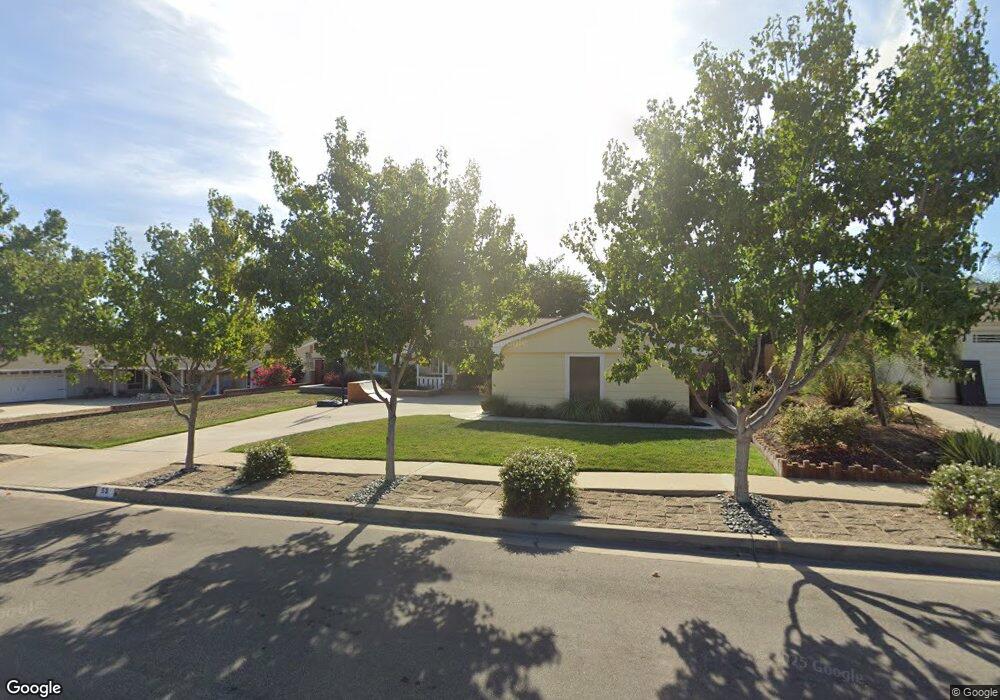
53 Camino Castanada Camarillo, CA 93010
Estimated Value: $1,032,000 - $1,057,000
4
Beds
3
Baths
1,949
Sq Ft
$537/Sq Ft
Est. Value
About This Home
This home is located at 53 Camino Castanada, Camarillo, CA 93010 and is currently estimated at $1,047,530, approximately $537 per square foot. 53 Camino Castanada is a home located in Ventura County with nearby schools including Las Posas Elementary School, Monte Vista Middle School, and Camarillo Academy of Progressive Education.
Ownership History
Date
Name
Owned For
Owner Type
Purchase Details
Closed on
Oct 2, 2009
Sold by
Gardner Mary D
Bought by
Adams John Drew and Adams Elizabeth
Current Estimated Value
Home Financials for this Owner
Home Financials are based on the most recent Mortgage that was taken out on this home.
Original Mortgage
$525,309
Outstanding Balance
$340,206
Interest Rate
4.92%
Mortgage Type
FHA
Estimated Equity
$707,324
Purchase Details
Closed on
Sep 16, 2009
Sold by
Karl Cicely M
Bought by
Gardner Mary D
Home Financials for this Owner
Home Financials are based on the most recent Mortgage that was taken out on this home.
Original Mortgage
$525,309
Outstanding Balance
$340,206
Interest Rate
4.92%
Mortgage Type
FHA
Estimated Equity
$707,324
Purchase Details
Closed on
Sep 18, 2006
Sold by
Karl Cicely M
Bought by
Karl Cicely M and Shelton Patricia A
Create a Home Valuation Report for This Property
The Home Valuation Report is an in-depth analysis detailing your home's value as well as a comparison with similar homes in the area
Home Values in the Area
Average Home Value in this Area
Purchase History
| Date | Buyer | Sale Price | Title Company |
|---|---|---|---|
| Adams John Drew | $535,000 | Stewart Title | |
| Gardner Mary D | -- | None Available | |
| Karl Cicely M | -- | None Available | |
| Karl Cicely M | -- | None Available |
Source: Public Records
Mortgage History
| Date | Status | Borrower | Loan Amount |
|---|---|---|---|
| Open | Adams John Drew | $525,309 |
Source: Public Records
Tax History Compared to Growth
Tax History
| Year | Tax Paid | Tax Assessment Tax Assessment Total Assessment is a certain percentage of the fair market value that is determined by local assessors to be the total taxable value of land and additions on the property. | Land | Improvement |
|---|---|---|---|---|
| 2025 | $7,512 | $690,578 | $345,290 | $345,288 |
| 2024 | $7,512 | $677,038 | $338,520 | $338,518 |
| 2023 | $7,242 | $663,763 | $331,882 | $331,881 |
| 2022 | $7,219 | $650,749 | $325,375 | $325,374 |
| 2021 | $6,959 | $637,990 | $318,995 | $318,995 |
| 2020 | $6,933 | $631,450 | $315,725 | $315,725 |
| 2019 | $6,901 | $619,070 | $309,535 | $309,535 |
| 2018 | $6,773 | $606,932 | $303,466 | $303,466 |
| 2017 | $6,373 | $595,032 | $297,516 | $297,516 |
| 2016 | $6,219 | $583,366 | $291,683 | $291,683 |
| 2015 | $6,153 | $574,604 | $287,302 | $287,302 |
| 2014 | $5,665 | $531,000 | $266,000 | $265,000 |
Source: Public Records
Map
Nearby Homes
- 51 Calle Escalon
- 858 Calle Portilla
- 1665 Avenida Soltura
- 1075 Seybolt Ave
- 800 Calle Higuera
- 61 Paseo Esplendido
- 73 Paseo Esplendido
- 106 Calle Bella Vista
- 813 N Calle Circulo
- 25 Encino Ave
- 1974 Sierra Mesa Dr
- 860 Big Horn Ct
- 2048 Sierra Mesa Dr
- 166 Bramble Ct
- 756 Edward Scholle Dr
- 405 Paseo Del Valle
- 15 Encino Ave
- 170 Spanish Moss Place
- 174 Gardenia Ave
- 170 Sawbuck St
- 31 Camino Castanada
- 69 Camino Castanada
- 60 Camino Estrada
- 350 Calle Navarro
- 38 Camino Estrada
- 9 Camino Castanada
- 52 Camino Castanada
- 91 Camino Castanada
- 86 Camino Estrada
- 30 Camino Castanada
- 68 Camino Castanada
- 12 Camino Estrada
- 8 Camino Castanada
- 90 Camino Castanada
- 47 Brea Ct
- 51 Camino Estrada
- 110 Camino Castanada
- 359 Calle Navarro
- 49 Brea Ct
- 375 Calle Navarro