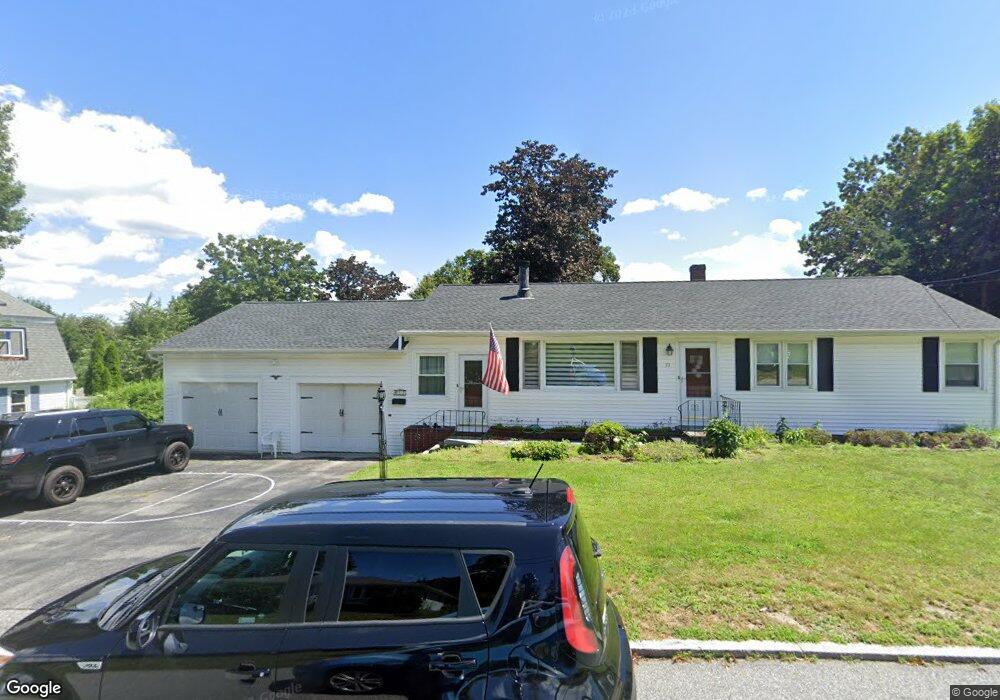
53 Conrad St Methuen, MA 01844
Downtown Methuen NeighborhoodEstimated Value: $598,222 - $654,000
3
Beds
2
Baths
2,444
Sq Ft
$258/Sq Ft
Est. Value
About This Home
This home is located at 53 Conrad St, Methuen, MA 01844 and is currently estimated at $630,806, approximately $258 per square foot. 53 Conrad St is a home located in Essex County with nearby schools including Tenney Grammar School, Methuen High School, and Lawrence Family Development Charter School.
Ownership History
Date
Name
Owned For
Owner Type
Purchase Details
Closed on
Jul 13, 2023
Sold by
Schwarz Joseph S and Schwarz Karen S
Bought by
Schwarz
Current Estimated Value
Purchase Details
Closed on
Aug 30, 1996
Sold by
Longo Carmen J
Bought by
Schwarz Joseph S
Create a Home Valuation Report for This Property
The Home Valuation Report is an in-depth analysis detailing your home's value as well as a comparison with similar homes in the area
Home Values in the Area
Average Home Value in this Area
Purchase History
| Date | Buyer | Sale Price | Title Company |
|---|---|---|---|
| Schwarz | -- | None Available | |
| Schwarz | -- | None Available | |
| Schwarz | -- | None Available | |
| Schwarz Joseph S | $133,000 | -- | |
| Schwarz Joseph S | $133,000 | -- |
Source: Public Records
Mortgage History
| Date | Status | Borrower | Loan Amount |
|---|---|---|---|
| Previous Owner | Schwarz Joseph S | $175,378 | |
| Previous Owner | Schwarz Joseph S | $35,000 | |
| Previous Owner | Schwarz Joseph S | $139,900 |
Source: Public Records
Tax History
| Year | Tax Paid | Tax Assessment Tax Assessment Total Assessment is a certain percentage of the fair market value that is determined by local assessors to be the total taxable value of land and additions on the property. | Land | Improvement |
|---|---|---|---|---|
| 2025 | $5,173 | $488,900 | $207,300 | $281,600 |
| 2024 | $5,112 | $470,700 | $189,100 | $281,600 |
| 2023 | $4,844 | $414,000 | $168,100 | $245,900 |
| 2022 | $4,665 | $357,500 | $140,100 | $217,400 |
| 2021 | $4,359 | $330,500 | $133,100 | $197,400 |
| 2020 | $4,346 | $323,400 | $133,100 | $190,300 |
| 2019 | $4,044 | $285,000 | $119,100 | $165,900 |
| 2018 | $3,947 | $276,600 | $119,100 | $157,500 |
| 2017 | $3,824 | $261,000 | $119,100 | $141,900 |
| 2016 | $3,657 | $246,900 | $112,100 | $134,800 |
| 2015 | $3,542 | $242,600 | $112,100 | $130,500 |
Source: Public Records
Map
Nearby Homes
- 22 Falcon St
- 65 Clayton Ave
- 35 Maplewood Ave
- 945 Riverside Dr Unit 3B
- 76 Haverhill St
- 2 Landmark Dr
- 20 Ruskin Ave
- 7 Field Ave
- 14-16 Cypress Ave
- 13 Caswell Ave
- 42-44 Cypress Ave
- 83 Arnold St
- 20-22 Ashland Ave
- 1 Perry Ave
- 42 Perley St
- 24 Railroad St
- 7-9 Carleton Ct
- 3 Oxyoke Dr
- 23 Bentley Cir
- 534 Forest St
Your Personal Tour Guide
Ask me questions while you tour the home.