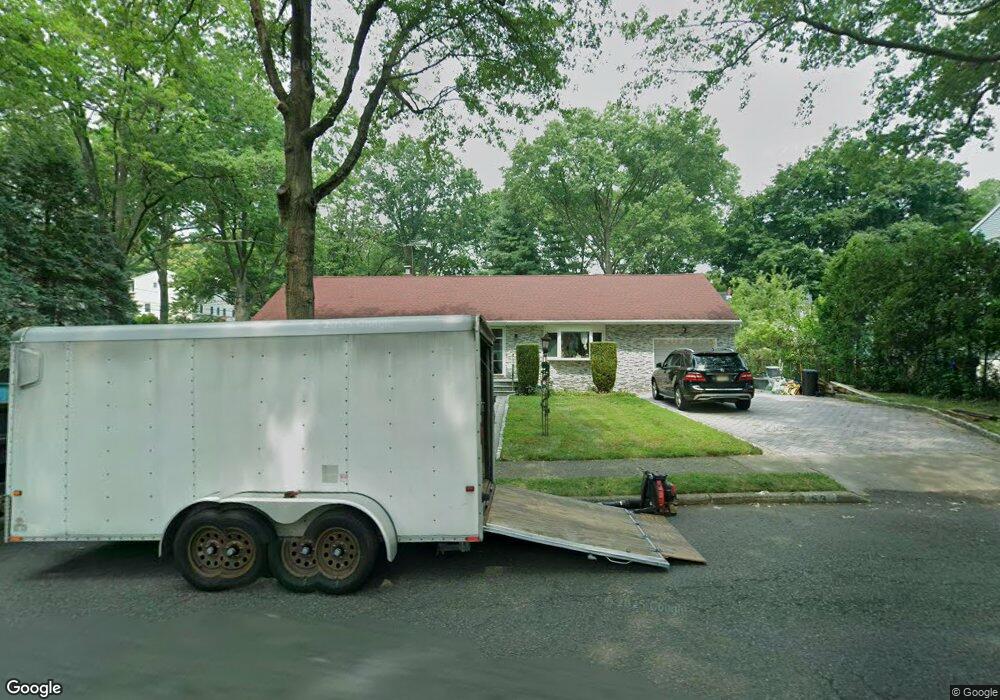
53 Engle Rd Paramus, NJ 07652
Estimated Value: $793,033 - $920,000
Studio
--
Bath
1,296
Sq Ft
$657/Sq Ft
Est. Value
About This Home
This home is located at 53 Engle Rd, Paramus, NJ 07652 and is currently estimated at $851,258, approximately $656 per square foot. 53 Engle Rd is a home located in Bergen County with nearby schools including Paramus High School and David Gregory School.
Ownership History
Date
Name
Owned For
Owner Type
Purchase Details
Closed on
Feb 15, 2000
Current Estimated Value
Purchase Details
Closed on
Apr 22, 1993
Sold by
Xu Margaret Ju Guang
Bought by
Xu Teresa Zg
Create a Home Valuation Report for This Property
The Home Valuation Report is an in-depth analysis detailing your home's value as well as a comparison with similar homes in the area
Home Values in the Area
Average Home Value in this Area
Purchase History
| Date | Buyer | Sale Price | Title Company |
|---|---|---|---|
| -- | $100 | -- | |
| Xu Teresa Z G | -- | -- | |
| Xu Teresa Zg | $10,400 | -- |
Source: Public Records
Tax History
| Year | Tax Paid | Tax Assessment Tax Assessment Total Assessment is a certain percentage of the fair market value that is determined by local assessors to be the total taxable value of land and additions on the property. | Land | Improvement |
|---|---|---|---|---|
| 2025 | $8,672 | $643,400 | $433,600 | $209,800 |
| 2024 | $8,290 | $572,800 | $374,100 | $198,700 |
| 2023 | $7,861 | $540,400 | $356,900 | $183,500 |
| 2022 | $7,861 | $506,500 | $333,600 | $172,900 |
| 2021 | $7,666 | $463,500 | $304,200 | $159,300 |
| 2020 | $7,201 | $451,500 | $294,200 | $157,300 |
| 2019 | $6,700 | $361,000 | $278,000 | $83,000 |
| 2018 | $6,617 | $361,000 | $278,000 | $83,000 |
| 2017 | $6,502 | $361,000 | $278,000 | $83,000 |
| 2016 | $6,325 | $361,000 | $278,000 | $83,000 |
| 2015 | $6,260 | $361,000 | $278,000 | $83,000 |
| 2014 | $6,206 | $361,000 | $278,000 | $83,000 |
Source: Public Records
Map
Nearby Homes
- 84 W Midland Ave
- 11 Gabriel Ct
- 14 Gabriel Ct
- 19 Gabriel Ct
- 24 Gabriel Ct
- 16 Gabriel Ct
- 496 Cedar Ln
- 461 Arthur Terrace
- 218 Mayfair Rd
- 232 W Midland Ave
- 375 Burnet Place
- 360 Valley View Ave
- 298 Buttonwood Dr
- 105 Circle Dr
- 495 Paramus Rd
- 304 Blauvelt Ct
- 311 N Farview Ave
- 645 Cambridge Rd
- 82 Azalea St
- 86 Azalea St
Your Personal Tour Guide
Ask me questions while you tour the home.