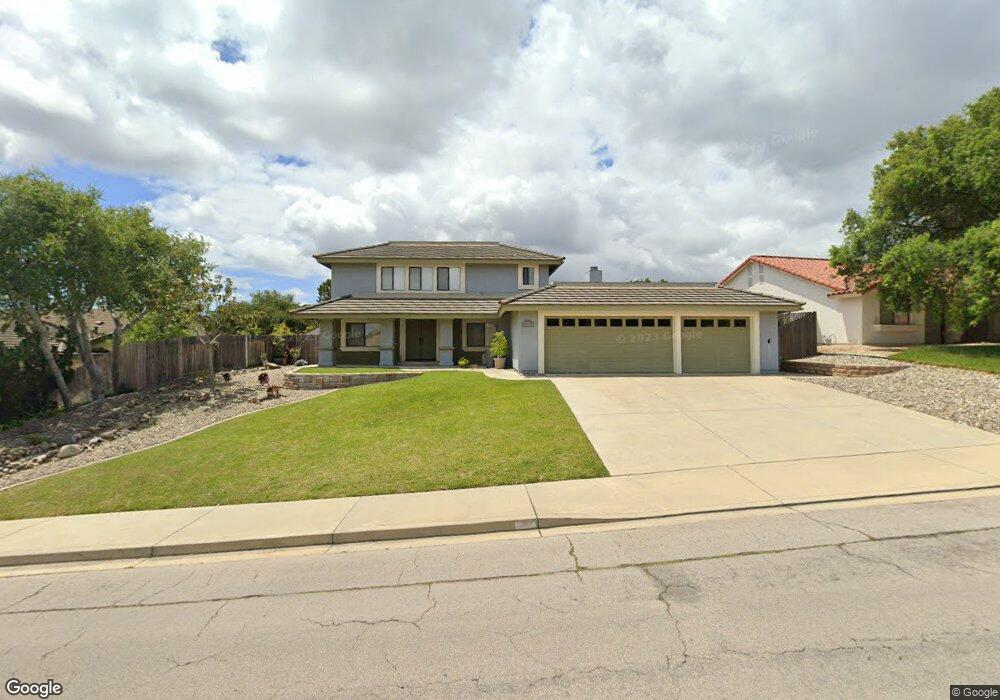
53 Galaxy Way Lompoc, CA 93436
Estimated Value: $837,029 - $965,000
4
Beds
3
Baths
2,525
Sq Ft
$351/Sq Ft
Est. Value
About This Home
This home is located at 53 Galaxy Way, Lompoc, CA 93436 and is currently estimated at $885,257, approximately $350 per square foot. 53 Galaxy Way is a home located in Santa Barbara County with nearby schools including Buena Vista Elementary School, Cabrillo High School, and Olive Grove Charter - Lompoc.
Ownership History
Date
Name
Owned For
Owner Type
Purchase Details
Closed on
Feb 13, 2015
Sold by
Salm David L and Salm Lisa M
Bought by
Martinez Richard
Current Estimated Value
Home Financials for this Owner
Home Financials are based on the most recent Mortgage that was taken out on this home.
Original Mortgage
$237,000
Outstanding Balance
$80,839
Interest Rate
2.92%
Mortgage Type
New Conventional
Estimated Equity
$804,418
Purchase Details
Closed on
Sep 28, 2005
Sold by
Dion Nancy A
Bought by
Salm David L and Salm Lisa M
Home Financials for this Owner
Home Financials are based on the most recent Mortgage that was taken out on this home.
Original Mortgage
$68,100
Interest Rate
5.74%
Mortgage Type
Credit Line Revolving
Purchase Details
Closed on
May 1, 2000
Sold by
Starner Leona W
Bought by
Dion Nancy A
Create a Home Valuation Report for This Property
The Home Valuation Report is an in-depth analysis detailing your home's value as well as a comparison with similar homes in the area
Home Values in the Area
Average Home Value in this Area
Purchase History
| Date | Buyer | Sale Price | Title Company |
|---|---|---|---|
| Martinez Richard | $487,000 | First American Title | |
| Salm David L | $681,000 | Stewart Title | |
| Dion Nancy A | -- | -- |
Source: Public Records
Mortgage History
| Date | Status | Borrower | Loan Amount |
|---|---|---|---|
| Open | Martinez Richard | $237,000 | |
| Previous Owner | Salm David L | $68,100 | |
| Previous Owner | Salm David L | $544,800 |
Source: Public Records
Tax History
| Year | Tax Paid | Tax Assessment Tax Assessment Total Assessment is a certain percentage of the fair market value that is determined by local assessors to be the total taxable value of land and additions on the property. | Land | Improvement |
|---|---|---|---|---|
| 2025 | $6,677 | $585,291 | $210,318 | $374,973 |
| 2023 | $6,677 | $562,565 | $202,152 | $360,413 |
| 2022 | $6,572 | $551,536 | $198,189 | $353,347 |
| 2021 | $6,645 | $540,722 | $194,303 | $346,419 |
| 2020 | $6,577 | $535,178 | $192,311 | $342,867 |
| 2019 | $6,477 | $524,686 | $188,541 | $336,145 |
| 2018 | $6,384 | $514,399 | $184,845 | $329,554 |
| 2017 | $6,185 | $504,314 | $181,221 | $323,093 |
| 2016 | $5,808 | $494,426 | $177,668 | $316,758 |
| 2014 | $4,704 | $402,000 | $165,000 | $237,000 |
Source: Public Records
Map
Nearby Homes
- 6 Stanford Cir
- 73 Stanford Cir
- 18 Galaxy Way
- 113 Gemini Ave
- 0 Oak Hill Dr Unit 24-783
- 4173 Oakwood Ct
- 4166 Oakwood Ct
- 240 Oak Hill Dr
- 4447 Falcon Dr
- 649 Burning Tree Way
- 4473 Greenbrier Rd
- 250 Saint Andrews Way
- 384 Falcon Crest Dr
- 372 Falcon Crest Dr
- 3939 Mesa Circle Dr
- 3922 Mesa Circle Dr
- 3825 Saturn Ave Unit 1
- 3843 Cassini Cir Unit 3
- 666 Carina Dr
- 549 Palomar Cir
Your Personal Tour Guide
Ask me questions while you tour the home.