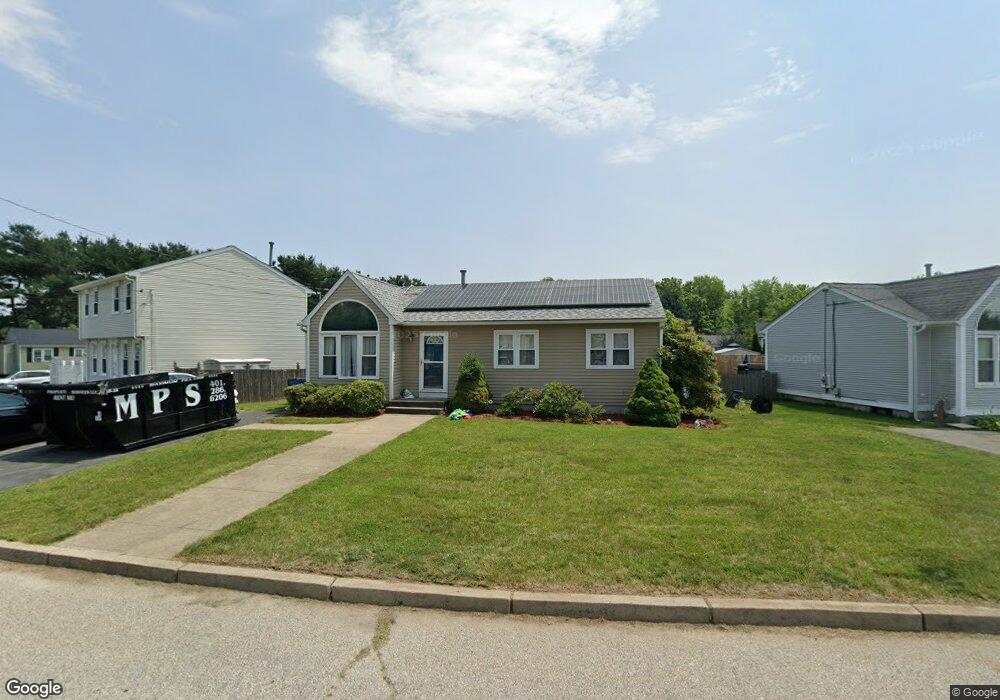
53 Justin Way Cranston, RI 02910
Eden Park NeighborhoodEstimated Value: $387,937 - $430,000
3
Beds
1
Bath
1,518
Sq Ft
$274/Sq Ft
Est. Value
About This Home
This home is located at 53 Justin Way, Cranston, RI 02910 and is currently estimated at $415,484, approximately $273 per square foot. 53 Justin Way is a home located in Providence County with nearby schools including Eden Park Elementary School, Park View Middle School, and Cranston High School East.
Ownership History
Date
Name
Owned For
Owner Type
Purchase Details
Closed on
May 2, 2007
Sold by
Francese Andrea and Francese Thomas
Bought by
Furgasso Julie A
Current Estimated Value
Home Financials for this Owner
Home Financials are based on the most recent Mortgage that was taken out on this home.
Original Mortgage
$248,000
Interest Rate
6.23%
Mortgage Type
Purchase Money Mortgage
Purchase Details
Closed on
Apr 26, 1995
Sold by
Landev Assoc Inc
Bought by
Francese Thomas F and Totolo Andrea M
Create a Home Valuation Report for This Property
The Home Valuation Report is an in-depth analysis detailing your home's value as well as a comparison with similar homes in the area
Home Values in the Area
Average Home Value in this Area
Purchase History
| Date | Buyer | Sale Price | Title Company |
|---|---|---|---|
| Furgasso Julie A | $248,000 | -- | |
| Francese Thomas F | $107,000 | -- |
Source: Public Records
Mortgage History
| Date | Status | Borrower | Loan Amount |
|---|---|---|---|
| Open | Francese Thomas F | $223,100 | |
| Closed | Francese Thomas F | $248,000 | |
| Previous Owner | Francese Thomas F | $145,000 | |
| Previous Owner | Francese Thomas F | $22,800 |
Source: Public Records
Tax History
| Year | Tax Paid | Tax Assessment Tax Assessment Total Assessment is a certain percentage of the fair market value that is determined by local assessors to be the total taxable value of land and additions on the property. | Land | Improvement |
|---|---|---|---|---|
| 2025 | $4,289 | $309,000 | $108,900 | $200,100 |
| 2024 | $4,205 | $309,000 | $108,900 | $200,100 |
| 2023 | $4,287 | $226,800 | $71,700 | $155,100 |
| 2022 | $4,198 | $226,800 | $71,700 | $155,100 |
| 2021 | $4,082 | $226,800 | $71,700 | $155,100 |
| 2020 | $3,853 | $185,500 | $68,300 | $117,200 |
| 2019 | $3,853 | $185,500 | $68,300 | $117,200 |
| 2018 | $3,764 | $185,500 | $68,300 | $117,200 |
| 2017 | $3,680 | $160,400 | $61,400 | $99,000 |
| 2016 | $3,601 | $160,400 | $61,400 | $99,000 |
| 2015 | $3,601 | $160,400 | $61,400 | $99,000 |
| 2014 | $3,437 | $150,500 | $61,400 | $89,100 |
Source: Public Records
Map
Nearby Homes
- 144 Laurens St
- 181 Grace St
- 124 Clarence St
- 10 Dale Ave
- 80 Colonial Ave
- 10 Woburn St
- 33 Hemlock Ave
- 152 Woodbine St
- 167 Forest Ave
- 103 Harper Ave
- 363 Pontiac Ave
- 64 Holburn Ave
- 90 Garden St
- 288 Pontiac Ave
- 25 Sharon St Unit 2
- 150 Riverside Ave
- 75 Sharon St
- 309 Station St
- 1302 Elmwood Ave
- 43 Woodbine St
Your Personal Tour Guide
Ask me questions while you tour the home.