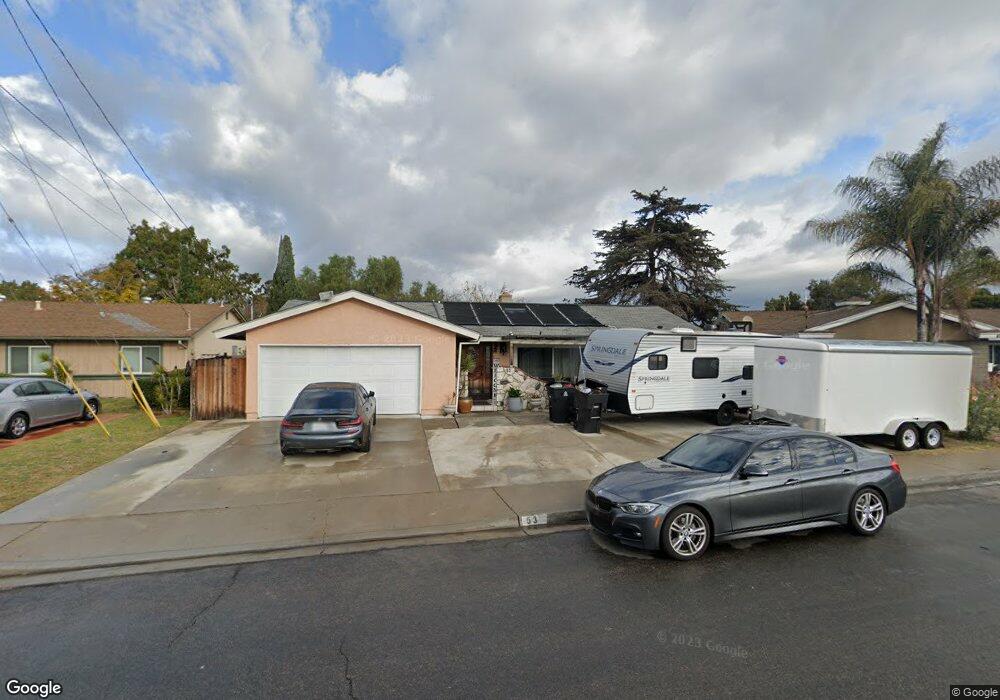
53 Millan Ct Chula Vista, CA 91910
Hilltop NeighborhoodEstimated Value: $779,000 - $896,000
5
Beds
3
Baths
1,884
Sq Ft
$451/Sq Ft
Est. Value
About This Home
This home is located at 53 Millan Ct, Chula Vista, CA 91910 and is currently estimated at $850,423, approximately $451 per square foot. 53 Millan Ct is a home located in San Diego County with nearby schools including Hilltop Drive Elementary School, Hilltop Middle School, and Hilltop Senior High School.
Ownership History
Date
Name
Owned For
Owner Type
Purchase Details
Closed on
Oct 23, 2013
Sold by
Chatfield Alan M and Chatfield Gail E
Bought by
Calderon Marcos and Vega Alejandra
Current Estimated Value
Home Financials for this Owner
Home Financials are based on the most recent Mortgage that was taken out on this home.
Original Mortgage
$302,400
Outstanding Balance
$224,285
Interest Rate
4.17%
Mortgage Type
New Conventional
Estimated Equity
$626,138
Purchase Details
Closed on
Nov 6, 2012
Sold by
Armenta Herrera Jose Maria
Bought by
Chatfield Alan M and Chatfield Gail E
Purchase Details
Closed on
Jun 3, 2003
Sold by
Armenta Herrera Jose Maria and Armenta Guerrera Jose Maria
Bought by
Armenta Herrera Jose Maria
Home Financials for this Owner
Home Financials are based on the most recent Mortgage that was taken out on this home.
Original Mortgage
$421,123
Interest Rate
2.79%
Mortgage Type
Reverse Mortgage Home Equity Conversion Mortgage
Purchase Details
Closed on
Jan 30, 1985
Create a Home Valuation Report for This Property
The Home Valuation Report is an in-depth analysis detailing your home's value as well as a comparison with similar homes in the area
Home Values in the Area
Average Home Value in this Area
Purchase History
| Date | Buyer | Sale Price | Title Company |
|---|---|---|---|
| Calderon Marcos | $378,000 | Lawyers Title | |
| Chatfield Alan M | $25,000 | None Available | |
| Armenta Herrera Jose Maria | -- | Fidelity National Title Co | |
| -- | $118,000 | -- |
Source: Public Records
Mortgage History
| Date | Status | Borrower | Loan Amount |
|---|---|---|---|
| Open | Calderon Marcos | $302,400 | |
| Previous Owner | Armenta Herrera Jose Maria | $421,123 | |
| Closed | Armenta Herrera Jose Maria | $421,123 |
Source: Public Records
Tax History Compared to Growth
Tax History
| Year | Tax Paid | Tax Assessment Tax Assessment Total Assessment is a certain percentage of the fair market value that is determined by local assessors to be the total taxable value of land and additions on the property. | Land | Improvement |
|---|---|---|---|---|
| 2025 | $5,344 | $463,362 | $247,127 | $216,235 |
| 2024 | $5,344 | $454,278 | $242,282 | $211,996 |
| 2023 | $5,271 | $445,372 | $237,532 | $207,840 |
| 2022 | $5,120 | $436,640 | $232,875 | $203,765 |
| 2021 | $5,002 | $428,079 | $228,309 | $199,770 |
| 2020 | $4,882 | $423,690 | $225,968 | $197,722 |
| 2019 | $4,756 | $415,384 | $221,538 | $193,846 |
| 2018 | $4,683 | $407,241 | $217,195 | $190,046 |
| 2017 | $10 | $399,257 | $212,937 | $186,320 |
| 2016 | $4,479 | $391,429 | $208,762 | $182,667 |
| 2015 | $4,416 | $385,551 | $205,627 | $179,924 |
| 2014 | $4,342 | $378,000 | $201,600 | $176,400 |
Source: Public Records
Map
Nearby Homes
- 0 Telegraph Canyon Rd Unit PTP2500640
- 174 K St
- 122 King St
- 52 E L St
- 177 El Capitan Dr
- 158 E L St
- 202 E J St
- 138 Shasta St
- 205 Camlau Dr Unit C
- 89 H St
- 62 Country Club Cir
- 172 Inkopah St
- 139 139 1/2 Woodlawn Ave
- 517 Avenida Centro Unit 106
- 514 Avenida Centro Unit 105
- 216 Alvarado St
- 1060 Del Mar Ave
- 414 1st Ave
- 415 J St
- 102 G St