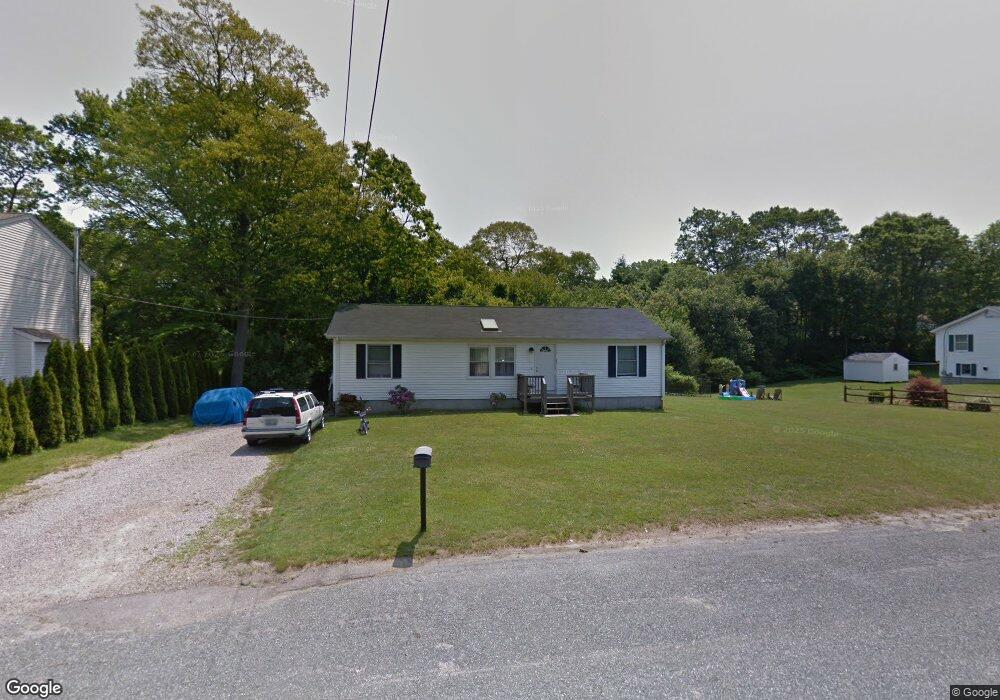
53 Robin Hollow Ln Westerly, RI 02891
Estimated Value: $588,000 - $677,000
3
Beds
2
Baths
1,840
Sq Ft
$338/Sq Ft
Est. Value
About This Home
This home is located at 53 Robin Hollow Ln, Westerly, RI 02891 and is currently estimated at $621,167, approximately $337 per square foot. 53 Robin Hollow Ln is a home located in Washington County with nearby schools including Westerly High School.
Ownership History
Date
Name
Owned For
Owner Type
Purchase Details
Closed on
Nov 28, 2007
Sold by
Cheienzia Excavation I
Bought by
Scanapieco Marc C and Scanapieco Maria Assunta
Current Estimated Value
Purchase Details
Closed on
Mar 16, 2005
Sold by
Future Homes Llc
Bought by
Scanapieco Marc and Scanapieco Maria
Purchase Details
Closed on
Jul 2, 2004
Sold by
Ann Alexis
Bought by
Future Homes Inc
Create a Home Valuation Report for This Property
The Home Valuation Report is an in-depth analysis detailing your home's value as well as a comparison with similar homes in the area
Home Values in the Area
Average Home Value in this Area
Purchase History
| Date | Buyer | Sale Price | Title Company |
|---|---|---|---|
| Scanapieco Marc C | $8,000 | -- | |
| Scanapieco Marc | $293,500 | -- | |
| Future Homes Inc | $129,000 | -- |
Source: Public Records
Mortgage History
| Date | Status | Borrower | Loan Amount |
|---|---|---|---|
| Open | Future Homes Inc | $232,744 | |
| Previous Owner | Future Homes Inc | $10,000 | |
| Previous Owner | Future Homes Inc | $260,000 |
Source: Public Records
Tax History Compared to Growth
Tax History
| Year | Tax Paid | Tax Assessment Tax Assessment Total Assessment is a certain percentage of the fair market value that is determined by local assessors to be the total taxable value of land and additions on the property. | Land | Improvement |
|---|---|---|---|---|
| 2025 | $3,566 | $501,500 | $186,000 | $315,500 |
| 2024 | $3,674 | $374,500 | $126,200 | $248,300 |
| 2023 | $3,603 | $374,500 | $126,200 | $248,300 |
| 2022 | $3,580 | $374,500 | $126,200 | $248,300 |
| 2021 | $3,635 | $315,500 | $109,700 | $205,800 |
| 2020 | $3,568 | $315,500 | $109,700 | $205,800 |
| 2019 | $3,259 | $291,000 | $109,700 | $181,300 |
| 2018 | $3,099 | $260,900 | $109,700 | $151,200 |
| 2017 | $3,024 | $260,900 | $109,700 | $151,200 |
| 2016 | $3,047 | $260,900 | $109,700 | $151,200 |
| 2015 | $2,948 | $272,500 | $117,300 | $155,200 |
| 2014 | $2,899 | $272,500 | $117,300 | $155,200 |
Source: Public Records
Map
Nearby Homes
- 5 Robin Hollow Ln
- 304 Post Rd
- 342 Post Rd
- 346 Post Rd
- 14 Piezzo Dr
- 12 Fallon Trail
- 160 Ross Hill Rd
- 120 Post Rd
- 137 Cove Point Rd E
- 11 Bucks Trail
- 194 Ross Hill Rd
- 5259 Old Post Rd
- 68 Shirley Dr
- 4 E Stuart St
- 118 Dunns Corner Rd
- 33 Stuart St
- 100 Weekapaug Rd
- 30 Clifford Dr
- 288 Shore Rd
- 80 Weekapaug Rd