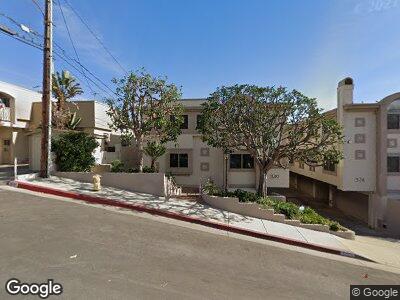
530 Sierra Place Unit 10 El Segundo, CA 90245
Estimated Value: $1,206,000 - $1,401,000
3
Beds
3
Baths
1,874
Sq Ft
$681/Sq Ft
Est. Value
About This Home
This home is located at 530 Sierra Place Unit 10, El Segundo, CA 90245 and is currently estimated at $1,275,467, approximately $680 per square foot. 530 Sierra Place Unit 10 is a home located in Los Angeles County with nearby schools including Center Street Elementary, El Segundo Middle School, and El Segundo High School.
Ownership History
Date
Name
Owned For
Owner Type
Purchase Details
Closed on
May 29, 2020
Sold by
Jeffries Nga
Bought by
Jeffries Nga and Jeffries Nga T
Current Estimated Value
Purchase Details
Closed on
Dec 12, 2008
Sold by
Jeffries Charles and Jeffries Nga
Bought by
Jeffries Nga
Home Financials for this Owner
Home Financials are based on the most recent Mortgage that was taken out on this home.
Original Mortgage
$300,000
Interest Rate
4.91%
Mortgage Type
New Conventional
Purchase Details
Closed on
Dec 22, 1997
Sold by
Fitzjarrell Philip B and Fitzjarrell Barbara E
Bought by
Jeffries Charles and Jeffries Nga
Home Financials for this Owner
Home Financials are based on the most recent Mortgage that was taken out on this home.
Original Mortgage
$196,000
Interest Rate
7.13%
Purchase Details
Closed on
Nov 23, 1993
Sold by
Widmann Jeffrey M
Bought by
Fitzjarrell Philip B and Fitzjarrell Barbara E
Create a Home Valuation Report for This Property
The Home Valuation Report is an in-depth analysis detailing your home's value as well as a comparison with similar homes in the area
Home Values in the Area
Average Home Value in this Area
Purchase History
| Date | Buyer | Sale Price | Title Company |
|---|---|---|---|
| Jeffries Nga | -- | None Available | |
| Jeffries Nga | -- | Landwood Title Company | |
| Jeffries Charles | $280,000 | First American | |
| Fitzjarrell Philip B | -- | American Coast Title |
Source: Public Records
Mortgage History
| Date | Status | Borrower | Loan Amount |
|---|---|---|---|
| Open | Jeffries Nga | $256,000 | |
| Closed | Jeffries Nga | $295,000 | |
| Closed | Jeffries Nga | $300,000 | |
| Closed | Jeffries Nga | $125,000 | |
| Closed | Jeffries Charles | $196,000 |
Source: Public Records
Tax History Compared to Growth
Tax History
| Year | Tax Paid | Tax Assessment Tax Assessment Total Assessment is a certain percentage of the fair market value that is determined by local assessors to be the total taxable value of land and additions on the property. | Land | Improvement |
|---|---|---|---|---|
| 2024 | $4,974 | $438,305 | $188,470 | $249,835 |
| 2023 | $4,846 | $429,712 | $184,775 | $244,937 |
| 2022 | $4,896 | $421,287 | $181,152 | $240,135 |
| 2021 | $4,818 | $413,027 | $177,600 | $235,427 |
| 2019 | $4,653 | $400,778 | $172,333 | $228,445 |
| 2018 | $4,365 | $392,920 | $168,954 | $223,966 |
| 2016 | $4,222 | $377,665 | $162,395 | $215,270 |
| 2015 | $4,169 | $371,993 | $159,956 | $212,037 |
| 2014 | $4,084 | $364,707 | $156,823 | $207,884 |
Source: Public Records
Map
Nearby Homes
- 617 E Pine Ave
- 521 Penn St
- 619 Center St
- 337 Penn St
- 802 Maryland St
- 318 E Maple Ave
- 848 Penn St
- 1341 E Grand Ave Unit C
- 535 E Walnut Ave Unit A
- 877 Center St
- 320 E Walnut Ave
- 305 Kansas St Unit B
- 703 Main St Unit 1
- 412 Richmond St
- 1013 E Acacia Ave
- 516 E Imperial Ave
- 328 E Imperial Ave Unit 1
- 232 W Oak Ave
- 950 Main St Unit 203
- 1629 E Palm Ave Unit 3
- 522 Sierra Place Unit 19
- 522 Sierra Place Unit 18
- 522 Sierra Place Unit 17
- 530 Sierra Place Unit 10
- 530 Sierra Place Unit 9
- 530 Sierra Place Unit 8
- 530 Sierra Place Unit 7
- 530 Sierra Place Unit 6
- 530 Sierra Place Unit 5
- 530 Sierra Place Unit 4
- 530 Sierra Place Unit 3
- 530 Sierra Place Unit 2
- 530 Sierra Place Unit 1
- 526 Sierra Place Unit 16
- 526 Sierra Place Unit 15
- 526 Sierra Place Unit 14
- 526 Sierra Place Unit 13
- 526 Sierra Place Unit 12
- 526 Sierra Place Unit 11
- 535 Lomita St