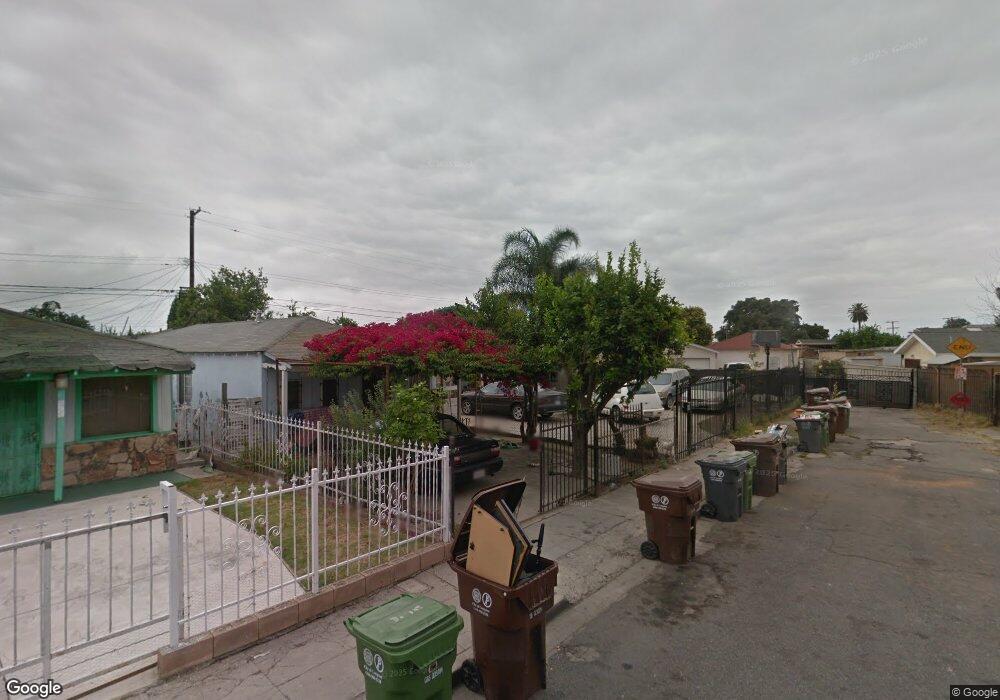
530 W Pear St Compton, CA 90222
Estimated Value: $502,000 - $632,000
3
Beds
1
Bath
1,048
Sq Ft
$543/Sq Ft
Est. Value
About This Home
This home is located at 530 W Pear St, Compton, CA 90222 and is currently estimated at $568,543, approximately $542 per square foot. 530 W Pear St is a home located in Los Angeles County with nearby schools including Washington Elementary School, Benjamin O. Davis Middle School, and Compton High School.
Ownership History
Date
Name
Owned For
Owner Type
Purchase Details
Closed on
Apr 17, 2002
Sold by
Hud
Bought by
Salazar Jesus
Current Estimated Value
Home Financials for this Owner
Home Financials are based on the most recent Mortgage that was taken out on this home.
Original Mortgage
$114,460
Interest Rate
6.52%
Purchase Details
Closed on
Nov 13, 2001
Sold by
Homeside Lending Inc
Bought by
Hud
Purchase Details
Closed on
Jun 1, 2001
Sold by
Cruz Alfonso R and Garcia Maria M
Bought by
Homeside Lending Inc
Purchase Details
Closed on
Jul 1, 1996
Sold by
Rivera Alfredo Salazar
Bought by
Cruz Alfonso A and Garcia Maria M
Home Financials for this Owner
Home Financials are based on the most recent Mortgage that was taken out on this home.
Original Mortgage
$120,399
Interest Rate
8.23%
Mortgage Type
FHA
Create a Home Valuation Report for This Property
The Home Valuation Report is an in-depth analysis detailing your home's value as well as a comparison with similar homes in the area
Home Values in the Area
Average Home Value in this Area
Purchase History
We collect this data history from publicly available records. To have your information removed, we recommend requesting removal directly through your county’s website.
| Date | Buyer | Sale Price | Title Company |
|---|---|---|---|
| Salazar Jesus | $118,000 | Fidelity Title | |
| Hud | $142,386 | -- | |
| Homeside Lending Inc | $142,386 | Fidelity Title | |
| Cruz Alfonso A | $121,000 | American Title Ins Co |
Source: Public Records
Mortgage History
We collect this data history from publicly available records. To have your information removed, we recommend requesting removal directly through your county’s website.
| Date | Status | Borrower | Loan Amount |
|---|---|---|---|
| Previous Owner | Salazar Jesus | $114,460 | |
| Previous Owner | Cruz Alfonso A | $120,399 |
Source: Public Records
Tax History
| Year | Tax Paid | Tax Assessment Tax Assessment Total Assessment is a certain percentage of the fair market value that is determined by local assessors to be the total taxable value of land and additions on the property. | Land | Improvement |
|---|---|---|---|---|
| 2025 | $3,834 | $189,706 | $108,613 | $81,093 |
| 2024 | $3,834 | $185,987 | $106,484 | $79,503 |
| 2023 | $3,778 | $182,342 | $104,397 | $77,945 |
| 2022 | $3,257 | $178,767 | $102,350 | $76,417 |
| 2021 | $3,285 | $175,263 | $100,344 | $74,919 |
| 2019 | $3,192 | $170,067 | $97,369 | $72,698 |
| 2018 | $3,056 | $166,733 | $95,460 | $71,273 |
| 2016 | $2,905 | $160,260 | $91,754 | $68,506 |
| 2015 | $2,777 | $157,853 | $90,376 | $67,477 |
| 2014 | $2,730 | $154,762 | $88,606 | $66,156 |
Source: Public Records
Map
Nearby Homes
- 2062 E Hatchway St
- 629 W Plum St
- 521 W Cherry St
- 417 W Pear St
- 2141 E Oris St
- 619 W Cherry St
- 522 W Cherry St
- 1608 N Grape Ave
- 720 W 137th St
- 2107 E Stockwell St
- 2121 E Shauer St
- 418 W Spruce St
- 2146 E Lucien St
- 2133 E Lucien St
- 2055 E Nord St
- 806 W Spruce St
- 13517 S Willowbrook Ave
- 409 W Cedar St
- 905 N Hickory Ave
- 13409 S Willowbrook Ave
- 526 W Pear St
- 2050 E Oris St
- 2050 E Oris St
- 522 W Pear St
- 531 W Peach St
- 2060 E Oris St
- 533 W Peach St
- 2058 E Oris St
- 520 W Pear St
- 2062 E Oris St
- 527 W Peach St
- 537 W Peach St
- 2066 E Oris St
- 518 W Pear St
- 1510 N Matthisen Ave
- 523 W Peach St
- 541 W Peach St
- 2046 E Oris St
- 2070 E Oris St
- 1504 N Matthisen Ave Unit 2
Your Personal Tour Guide
Ask me questions while you tour the home.