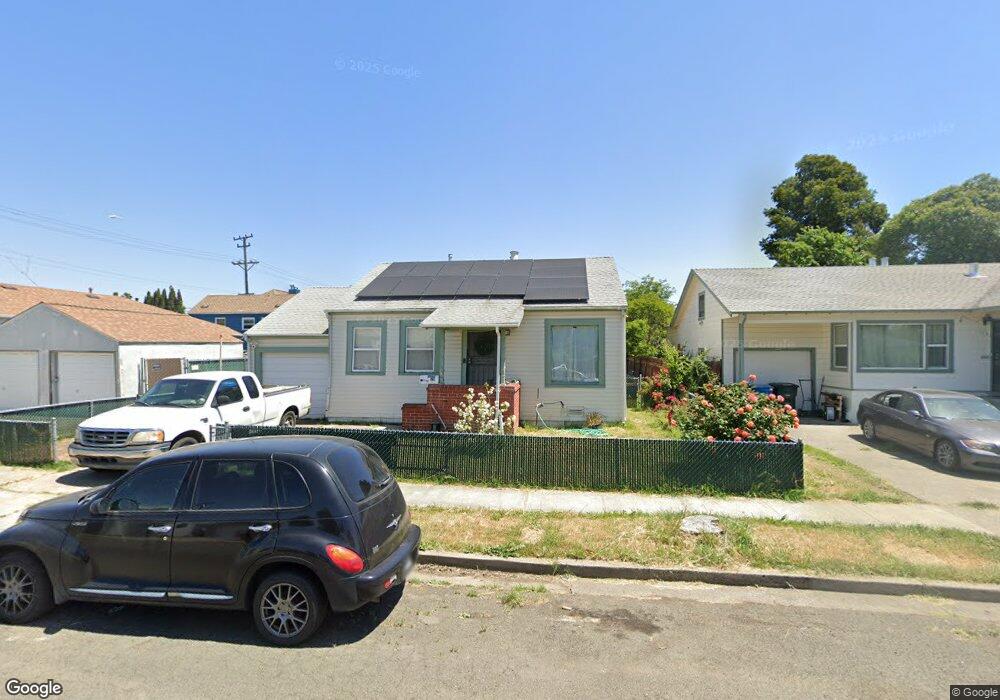
530 Yuba St Vallejo, CA 94590
West Vallejo NeighborhoodEstimated Value: $343,542 - $390,000
2
Beds
1
Bath
784
Sq Ft
$477/Sq Ft
Est. Value
About This Home
This home is located at 530 Yuba St, Vallejo, CA 94590 and is currently estimated at $373,636, approximately $476 per square foot. 530 Yuba St is a home located in Solano County with nearby schools including Highland Elementary, Vallejo High School, and Saint Vincent Ferrer School.
Ownership History
Date
Name
Owned For
Owner Type
Purchase Details
Closed on
May 19, 2018
Sold by
Thorlton Roxanne O
Bought by
Thorlton Roxanne and The Roxanne Thorlton Living Tr
Current Estimated Value
Purchase Details
Closed on
Aug 13, 2011
Sold by
Thorlton Diane L
Bought by
Thorlton Roxanne O
Purchase Details
Closed on
Aug 20, 2005
Sold by
Thorlton Diane L
Bought by
Thorlton Diane L and Thorlton Roxanne O
Create a Home Valuation Report for This Property
The Home Valuation Report is an in-depth analysis detailing your home's value as well as a comparison with similar homes in the area
Home Values in the Area
Average Home Value in this Area
Purchase History
| Date | Buyer | Sale Price | Title Company |
|---|---|---|---|
| Thorlton Roxanne | -- | None Available | |
| Thorlton Rozanne | -- | None Available | |
| Thorlton Roxanne O | -- | None Available | |
| Thorlton Diane L | -- | None Available | |
| Thorlton Diane L | -- | -- |
Source: Public Records
Tax History Compared to Growth
Tax History
| Year | Tax Paid | Tax Assessment Tax Assessment Total Assessment is a certain percentage of the fair market value that is determined by local assessors to be the total taxable value of land and additions on the property. | Land | Improvement |
|---|---|---|---|---|
| 2025 | $1,516 | $42,276 | $15,220 | $27,056 |
| 2024 | $1,516 | $41,448 | $14,922 | $26,526 |
| 2023 | $1,364 | $40,636 | $14,630 | $26,006 |
| 2022 | $1,246 | $39,841 | $14,344 | $25,497 |
| 2021 | $1,214 | $39,061 | $14,063 | $24,998 |
| 2020 | $1,186 | $38,661 | $13,919 | $24,742 |
| 2019 | $1,118 | $37,904 | $13,647 | $24,257 |
| 2018 | $1,025 | $37,162 | $13,380 | $23,782 |
| 2017 | $948 | $36,434 | $13,118 | $23,316 |
| 2016 | $375 | $35,720 | $12,861 | $22,859 |
| 2015 | $369 | $35,184 | $12,668 | $22,516 |
| 2014 | $363 | $34,495 | $12,420 | $22,075 |
Source: Public Records
Map
Nearby Homes