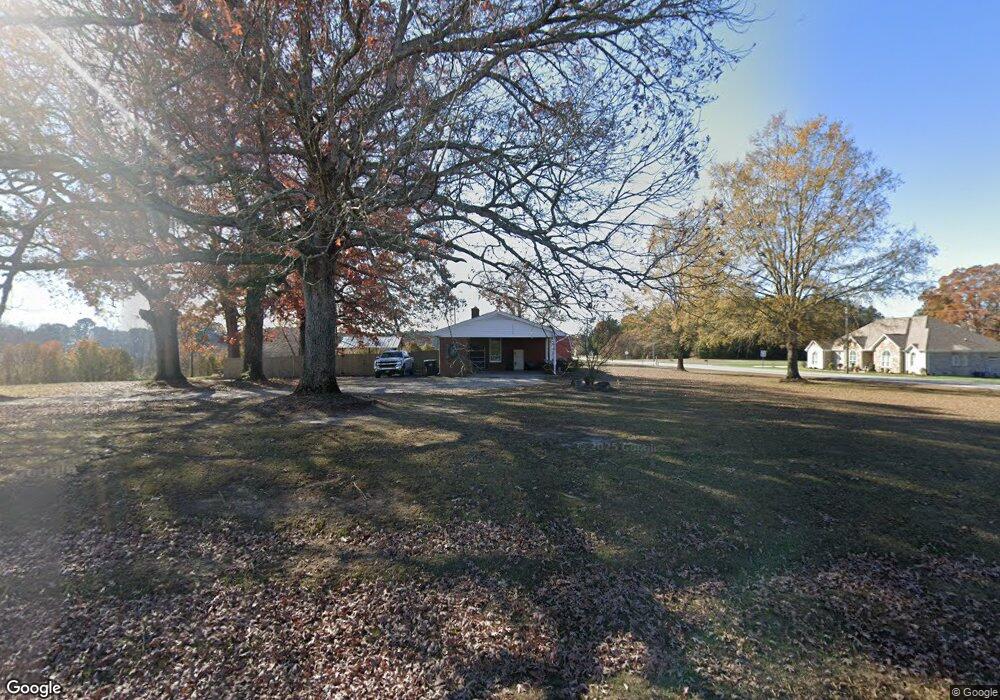
5300 Grasshopper Rd Raleigh, NC 27610
Shotwell NeighborhoodEstimated Value: $358,980 - $437,000
--
Bed
1
Bath
1,753
Sq Ft
$225/Sq Ft
Est. Value
About This Home
This home is located at 5300 Grasshopper Rd, Raleigh, NC 27610 and is currently estimated at $394,745, approximately $225 per square foot. 5300 Grasshopper Rd is a home located in Wake County with nearby schools including Barwell Road Elementary School, Neuse River Middle School, and Knightdale High.
Ownership History
Date
Name
Owned For
Owner Type
Purchase Details
Closed on
Jan 10, 2022
Sold by
Miller Phyllis P
Bought by
Coley Joseph S and Searles Michael Shane
Current Estimated Value
Home Financials for this Owner
Home Financials are based on the most recent Mortgage that was taken out on this home.
Original Mortgage
$139,000
Outstanding Balance
$119,530
Interest Rate
3.11%
Mortgage Type
New Conventional
Estimated Equity
$275,215
Purchase Details
Closed on
Jul 11, 2008
Sold by
Broadwell Don Edward
Bought by
Coley Joseph S and Miller Phyllis P
Home Financials for this Owner
Home Financials are based on the most recent Mortgage that was taken out on this home.
Original Mortgage
$174,630
Interest Rate
6.27%
Mortgage Type
FHA
Purchase Details
Closed on
Jan 11, 2000
Sold by
Broadwell Henry Jesse
Bought by
Broadwell Don Edward
Create a Home Valuation Report for This Property
The Home Valuation Report is an in-depth analysis detailing your home's value as well as a comparison with similar homes in the area
Home Values in the Area
Average Home Value in this Area
Purchase History
| Date | Buyer | Sale Price | Title Company |
|---|---|---|---|
| Coley Joseph S | -- | Magnolia Title | |
| Coley Joseph S | $185,000 | None Available | |
| Broadwell Don Edward | -- | -- |
Source: Public Records
Mortgage History
| Date | Status | Borrower | Loan Amount |
|---|---|---|---|
| Open | Coley Joseph S | $139,000 | |
| Previous Owner | Coley Joseph S | $174,630 |
Source: Public Records
Tax History Compared to Growth
Tax History
| Year | Tax Paid | Tax Assessment Tax Assessment Total Assessment is a certain percentage of the fair market value that is determined by local assessors to be the total taxable value of land and additions on the property. | Land | Improvement |
|---|---|---|---|---|
| 2025 | $2,164 | $335,237 | $111,680 | $223,557 |
| 2024 | $2,102 | $335,237 | $111,680 | $223,557 |
| 2023 | $1,539 | $194,824 | $61,740 | $133,084 |
| 2022 | $1,427 | $194,824 | $61,740 | $133,084 |
| 2021 | $1,389 | $194,824 | $61,740 | $133,084 |
| 2020 | $1,366 | $194,824 | $61,740 | $133,084 |
| 2019 | $1,314 | $158,394 | $55,760 | $102,634 |
| 2018 | $1,209 | $158,394 | $55,760 | $102,634 |
| 2017 | $1,146 | $158,394 | $55,760 | $102,634 |
| 2016 | $1,123 | $158,394 | $55,760 | $102,634 |
| 2015 | $1,173 | $165,981 | $63,680 | $102,301 |
| 2014 | $1,112 | $165,981 | $63,680 | $102,301 |
Source: Public Records
Map
Nearby Homes
- 1017 Harvest Mill Ct
- 4217 Grahamstone Rd
- 8323 Poole Rd
- 1616 River Bend Ln
- 1129 Poplar Creek Trail
- 1612 Font Hills Ln
- 131 English Violet Ln
- 2517 Oakes Plantation Dr
- 1317 Sweet Charm Ln
- 1417 Stone Wealth Dr
- 1305 Shakentown St
- 5204 Sleepy Falls Run
- 5212 Sapphire Springs Dr
- 1528 Stone Wealth Dr
- 4907 Sleepy Falls Run
- 5104 Parkerwood Dr
- 4373 Stony Falls Way
- 5404 Rutledgeville Ln
- 5200 Limewood St
- 1005 Whispering Creek Ct
- 2016 Auburn Knightdale Rd
- 5237 Grasshopper Rd
- 5233 Grasshopper Rd
- 5229 Grasshopper Rd
- 5210 Grasshopper Rd
- 2028 Auburn Knightdale Rd
- 5221 Grasshopper Rd
- 5324 Grasshopper Rd
- 2032 Auburn Knightdale Rd
- 2024 Auburn Knightdale Rd
- 5209 Grasshopper Rd
- 1309 Lizzie Ln
- 5325 Grasshopper Rd
- 1940 Bethlehem Rd
- 1216 Lottery Ln
- 1212 Lottery Ln
- 5401 Grasshopper Rd
- 2104 Auburn Knightdale Rd
- 2040 Bethlehem Rd
- 5206 Grasshopper Rd