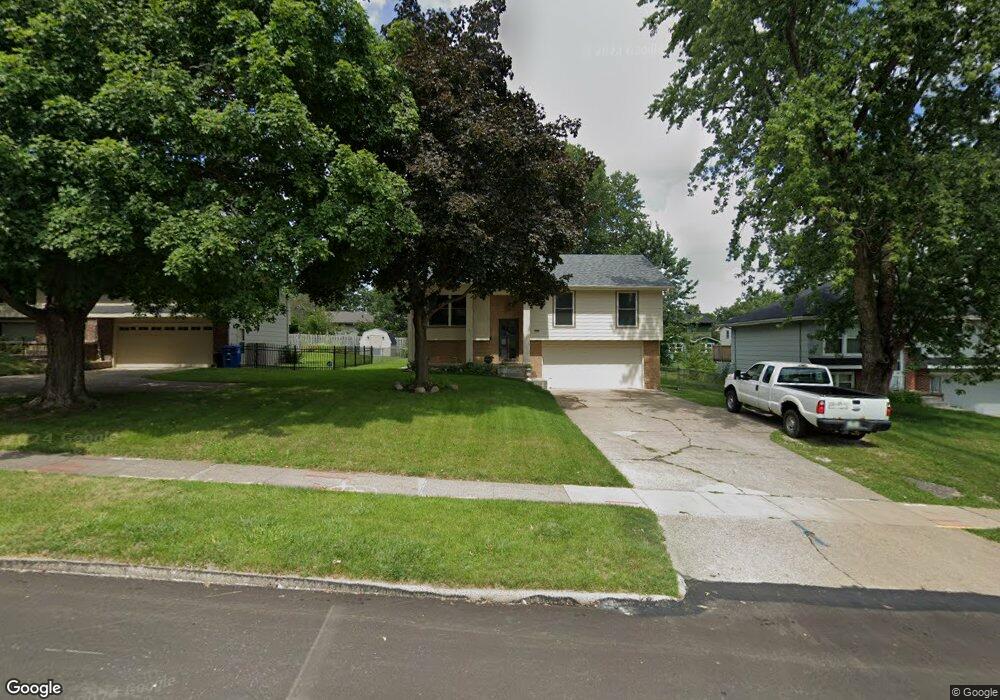
5301 Aurora Ave Des Moines, IA 50310
Meredith NeighborhoodEstimated Value: $230,931 - $265,000
4
Beds
2
Baths
1,068
Sq Ft
$232/Sq Ft
Est. Value
About This Home
This home is located at 5301 Aurora Ave, Des Moines, IA 50310 and is currently estimated at $247,483, approximately $231 per square foot. 5301 Aurora Ave is a home located in Polk County with nearby schools including Lawson Elementary School, Johnston Middle School, and Summit Middle School.
Ownership History
Date
Name
Owned For
Owner Type
Purchase Details
Closed on
Sep 25, 2001
Sold by
Begel Dorothy A
Bought by
Begel Dorothy A and Begel Robert Allan
Current Estimated Value
Purchase Details
Closed on
Jul 29, 1999
Sold by
Austin William M and Austin Jennifer L
Bought by
Avdic Mujo and Avdic Hajrija
Home Financials for this Owner
Home Financials are based on the most recent Mortgage that was taken out on this home.
Original Mortgage
$84,300
Outstanding Balance
$23,856
Interest Rate
7.69%
Estimated Equity
$223,627
Create a Home Valuation Report for This Property
The Home Valuation Report is an in-depth analysis detailing your home's value as well as a comparison with similar homes in the area
Home Values in the Area
Average Home Value in this Area
Purchase History
| Date | Buyer | Sale Price | Title Company |
|---|---|---|---|
| Begel Dorothy A | -- | -- | |
| Avdic Mujo | $105,000 | -- |
Source: Public Records
Mortgage History
| Date | Status | Borrower | Loan Amount |
|---|---|---|---|
| Open | Avdic Mujo | $84,300 |
Source: Public Records
Tax History Compared to Growth
Tax History
| Year | Tax Paid | Tax Assessment Tax Assessment Total Assessment is a certain percentage of the fair market value that is determined by local assessors to be the total taxable value of land and additions on the property. | Land | Improvement |
|---|---|---|---|---|
| 2025 | $3,522 | $227,800 | $49,700 | $178,100 |
| 2024 | $3,522 | $199,900 | $43,100 | $156,800 |
| 2023 | $3,654 | $199,900 | $43,100 | $156,800 |
| 2022 | $4,084 | $174,400 | $38,400 | $136,000 |
| 2021 | $4,014 | $174,400 | $38,400 | $136,000 |
| 2020 | $3,938 | $163,500 | $35,900 | $127,600 |
| 2019 | $3,670 | $163,500 | $35,900 | $127,600 |
| 2018 | $3,628 | $145,800 | $31,400 | $114,400 |
| 2017 | $3,352 | $145,800 | $31,400 | $114,400 |
| 2016 | $3,268 | $133,100 | $28,600 | $104,500 |
| 2015 | $3,268 | $133,100 | $28,600 | $104,500 |
| 2014 | $3,276 | $132,200 | $28,200 | $104,000 |
Source: Public Records
Map
Nearby Homes