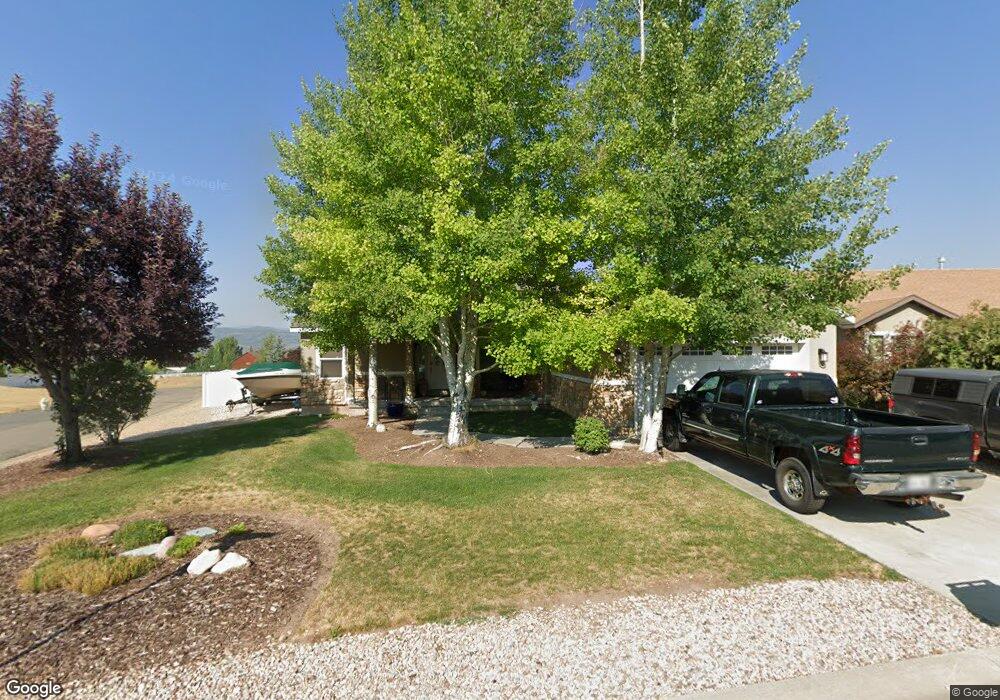
5301 Frontier Cir Unit 68 Oakley, UT 84055
Kamas Valley NeighborhoodEstimated Value: $762,000 - $1,009,000
5
Beds
3
Baths
3,048
Sq Ft
$283/Sq Ft
Est. Value
About This Home
This home is located at 5301 Frontier Cir Unit 68, Oakley, UT 84055 and is currently estimated at $861,870, approximately $282 per square foot. 5301 Frontier Cir Unit 68 is a home located in Summit County with nearby schools including South Summit Elementary School and South Summit High School.
Ownership History
Date
Name
Owned For
Owner Type
Purchase Details
Closed on
Apr 27, 2020
Sold by
Bush Nanette M and Potts Taylor M
Bought by
Bush Nanette M
Current Estimated Value
Purchase Details
Closed on
Apr 7, 2020
Sold by
Bush Nanette M
Bought by
Bush Nanette M and Potts Taylor M
Purchase Details
Closed on
Aug 29, 2018
Sold by
Street Stacy R and Street Colette
Bought by
Bush Nanette M
Home Financials for this Owner
Home Financials are based on the most recent Mortgage that was taken out on this home.
Original Mortgage
$347,650
Outstanding Balance
$300,887
Interest Rate
4.25%
Mortgage Type
Adjustable Rate Mortgage/ARM
Estimated Equity
$560,983
Purchase Details
Closed on
Nov 28, 2016
Sold by
Street Stacy R
Bought by
Street Stacy R and Street Colette
Purchase Details
Closed on
Nov 17, 2008
Sold by
Mountainlands Community Housing Assn
Bought by
Strett Stacy R
Home Financials for this Owner
Home Financials are based on the most recent Mortgage that was taken out on this home.
Original Mortgage
$279,217
Interest Rate
6.47%
Mortgage Type
USDA
Create a Home Valuation Report for This Property
The Home Valuation Report is an in-depth analysis detailing your home's value as well as a comparison with similar homes in the area
Home Values in the Area
Average Home Value in this Area
Purchase History
| Date | Buyer | Sale Price | Title Company |
|---|---|---|---|
| Bush Nanette M | -- | Accommodation | |
| Bush Nanette M | -- | Accommodation | |
| Bush Nanette M | -- | Us Title Insurance Agency | |
| Street Stacy R | -- | Real Advantage Title Insuran | |
| Strett Stacy R | -- | None Available |
Source: Public Records
Mortgage History
| Date | Status | Borrower | Loan Amount |
|---|---|---|---|
| Open | Bush Nanette M | $347,650 | |
| Previous Owner | Strett Stacy R | $279,217 |
Source: Public Records
Tax History Compared to Growth
Tax History
| Year | Tax Paid | Tax Assessment Tax Assessment Total Assessment is a certain percentage of the fair market value that is determined by local assessors to be the total taxable value of land and additions on the property. | Land | Improvement |
|---|---|---|---|---|
| 2024 | $2,255 | $381,374 | $137,500 | $243,874 |
| 2023 | $2,255 | $381,374 | $137,500 | $243,874 |
| 2022 | $1,958 | $296,715 | $110,000 | $186,715 |
| 2021 | $1,834 | $233,134 | $71,500 | $161,634 |
| 2020 | $1,737 | $204,312 | $54,450 | $149,862 |
| 2019 | $1,949 | $371,477 | $99,000 | $272,477 |
| 2018 | $1,677 | $183,202 | $48,950 | $134,252 |
| 2017 | $1,542 | $172,752 | $38,500 | $134,252 |
| 2016 | $1,554 | $163,385 | $38,500 | $124,885 |
| 2015 | $1,543 | $163,385 | $0 | $0 |
| 2013 | $1,527 | $152,055 | $0 | $0 |
Source: Public Records
Map
Nearby Homes
- 5167 Rodeo Cir Unit 6
- 5167 Rodeo Cir
- 795 Bridle Way
- 5402 N 750 W
- 949 River Haven Rd S Unit 115
- 940 River Haven Rd W Unit 103
- 972 River Haven Rd Unit 101
- 949 River Haven Rd S
- 5420 N Estates Ln
- 64 S Navajo Way N
- 4498 E Weber Canyon Rd S Unit MO23
- 4498 E Weber Canyon Rd S
- 1400 E Weber Wild Rd
- 764 Blue Spruce Dr Unit 764
- 5426 E Colter Unit 33
- 5426 E Colter Rd N
- 829 River Haven Ln
- 1375 E Pinion Ln
- 163 Mt Aire Upper Loop
- 5467 E Lewis And Clark Rd N
- 5301 Frontier Cir
- 844 Bronc Trail
- 5315 Frontier Cir
- 5284 Western Cir
- 856 Bronc Trail
- 5329 Frontier Cir
- 5308 Western Cir
- 5308 Frontier Cir
- 5324 Western Cir
- 5326 Frontier Cir
- 5243 Riata Cir
- 5243 Riata Cir Unit 52
- 5341 Frontier Cir
- 5239 Riata Cir
- 5240 Riata Cir
- 5336 Western Cir
- 5338 Frontier Cir
- 5232 Saddle Dr
- 808 Bronc Trail
- 5233 Riata Cir