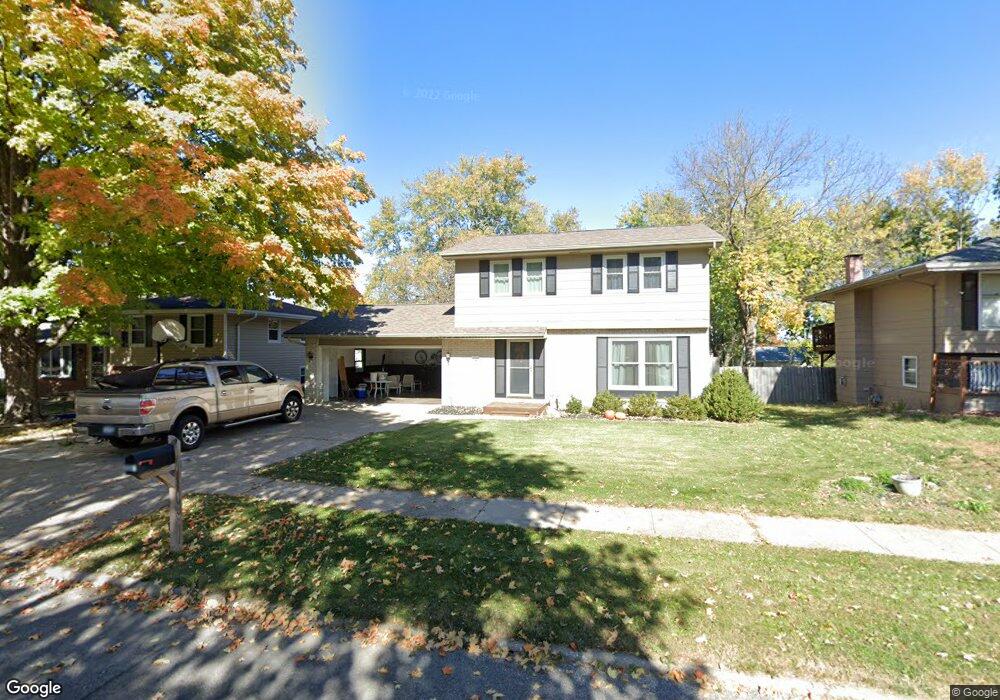
5301 Merced St Des Moines, IA 50310
Meredith NeighborhoodEstimated Value: $248,000 - $317,000
4
Beds
2
Baths
1,660
Sq Ft
$171/Sq Ft
Est. Value
About This Home
This home is located at 5301 Merced St, Des Moines, IA 50310 and is currently estimated at $284,293, approximately $171 per square foot. 5301 Merced St is a home located in Polk County with nearby schools including Lawson Elementary School, Johnston Middle School, and Summit Middle School.
Ownership History
Date
Name
Owned For
Owner Type
Purchase Details
Closed on
Feb 25, 2013
Sold by
Parker Edward C and Parker Rhonda E
Bought by
Dimensions Real Estate Llc
Current Estimated Value
Purchase Details
Closed on
Sep 8, 2011
Sold by
Fannie Mae
Bought by
Parker Edward Charles
Purchase Details
Closed on
Nov 12, 2010
Sold by
Ahmed Teralee Sue
Bought by
Federal National Mortgage Association
Create a Home Valuation Report for This Property
The Home Valuation Report is an in-depth analysis detailing your home's value as well as a comparison with similar homes in the area
Home Values in the Area
Average Home Value in this Area
Purchase History
| Date | Buyer | Sale Price | Title Company |
|---|---|---|---|
| Dimensions Real Estate Llc | -- | None Available | |
| Dimensions Real Estate Llc | -- | None Available | |
| Parker Edward Charles | $109,500 | None Available | |
| Federal National Mortgage Association | -- | None Available |
Source: Public Records
Tax History Compared to Growth
Tax History
| Year | Tax Paid | Tax Assessment Tax Assessment Total Assessment is a certain percentage of the fair market value that is determined by local assessors to be the total taxable value of land and additions on the property. | Land | Improvement |
|---|---|---|---|---|
| 2025 | $4,720 | $278,800 | $52,300 | $226,500 |
| 2024 | $4,720 | $244,500 | $45,300 | $199,200 |
| 2023 | $4,774 | $244,500 | $45,300 | $199,200 |
| 2022 | $5,264 | $213,200 | $40,400 | $172,800 |
| 2021 | $5,176 | $213,200 | $40,400 | $172,800 |
| 2020 | $5,082 | $199,700 | $37,700 | $162,000 |
| 2019 | $4,764 | $199,700 | $37,700 | $162,000 |
| 2018 | $4,716 | $178,200 | $33,000 | $145,200 |
| 2017 | $4,422 | $178,200 | $33,000 | $145,200 |
| 2016 | $4,316 | $164,300 | $30,100 | $134,200 |
| 2015 | $4,316 | $164,300 | $30,100 | $134,200 |
| 2014 | $4,236 | $164,700 | $28,800 | $135,900 |
Source: Public Records
Map
Nearby Homes