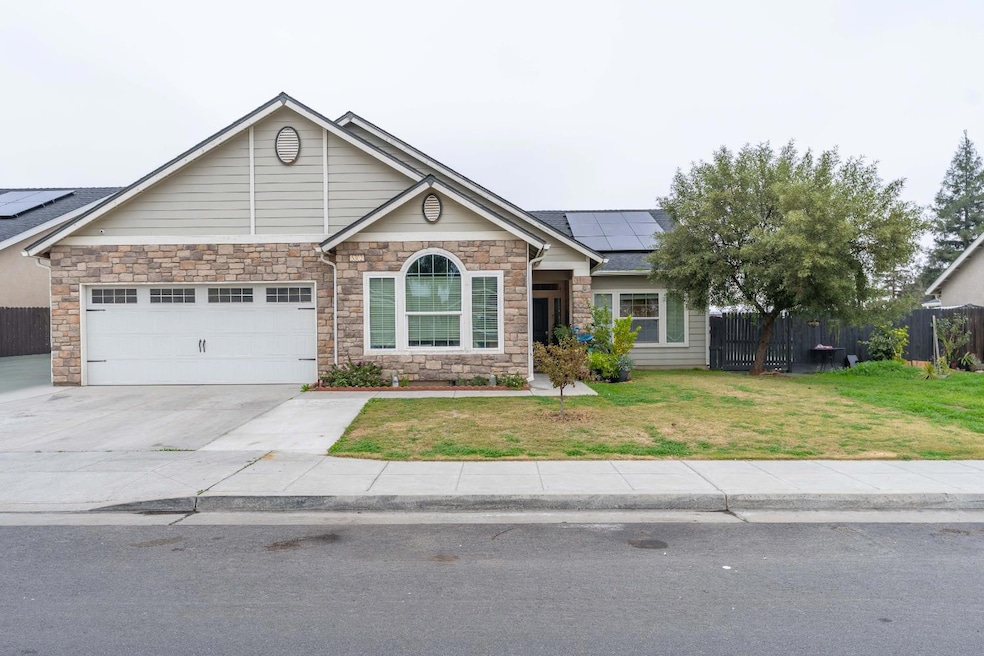
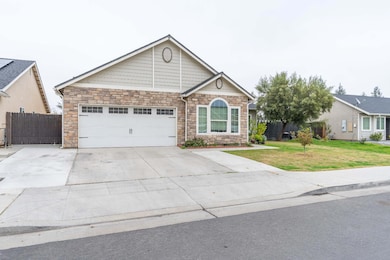
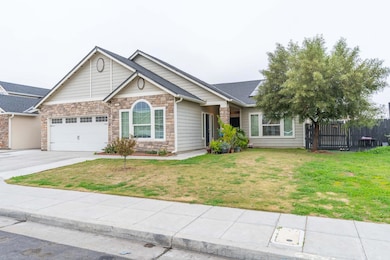
5302 W Homan Ave Fresno, CA 93722
West Fresno NeighborhoodEstimated payment $3,139/month
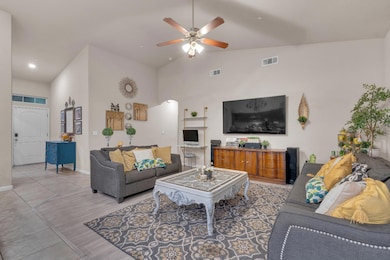
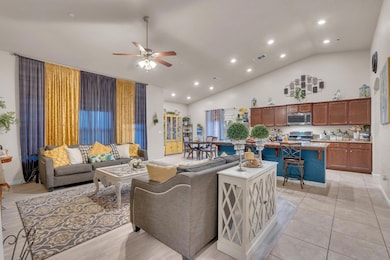
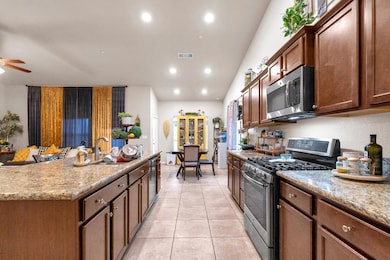
About This Home
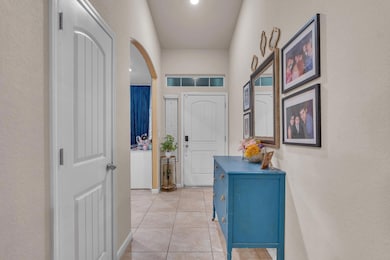
This elegant 4-bedroom, 3-bath residence combines comfort, style, and versatility in one of Fresno's most sought-after neighborhoods. Upon entering, you're greeted by impressive high ceilings that enhance the home's bright, open ambiance. The expansive open-concept kitchen flows effortlessly into the dining and living areas, creating an inviting space ideal for both everyday living and sophisticated entertaining. Thoughtfully designed for modern lifestyles, the home features a private mother-in-law suite, perfect for extended family, visiting guests, or a dedicated creative space. A separate office offers a quiet retreat for remote work or study. The luxurious primary suite provides a serene escape, complete with a spacious en-suite bathroom for optimal comfort and privacy. Enjoy energy-efficient living with owned solar panels, offering long-term savings and sustainability. The two-car garage adds convenience with generous parking and storage options. With its refined layout, multiple flexible living areas, and premium features, this home delivers the perfect blend of elegance and functionality. Don't miss the opportunity to make this exceptional property your own.
Listing Agent
Daniel Espinoza
Universal Realty Services, Inc License #02047236 Listed on: 12/05/2025
Open House Schedule
-
Saturday, December 06, 20251:00 to 4:00 pm12/6/2025 1:00:00 PM +00:0012/6/2025 4:00:00 PM +00:00Add to Calendar
Home Details
Home Type
- Single Family
Est. Annual Taxes
- $4,945
Year Built
- Built in 2015
Lot Details
- 7,980 Sq Ft Lot
- Property is zoned RS4
Home Design
- Concrete Foundation
- Tile Roof
- Stucco
Interior Spaces
- 2,257 Sq Ft Home
- 1-Story Property
- Laundry in unit
Bedrooms and Bathrooms
- 4 Bedrooms
- 3 Bathrooms
Utilities
- Central Heating and Cooling System
Map
Home Values in the Area
Average Home Value in this Area
Tax History
| Year | Tax Paid | Tax Assessment Tax Assessment Total Assessment is a certain percentage of the fair market value that is determined by local assessors to be the total taxable value of land and additions on the property. | Land | Improvement |
|---|---|---|---|---|
| 2025 | $4,945 | $359,666 | $81,515 | $278,151 |
| 2023 | $4,620 | $345,701 | $78,350 | $267,351 |
| 2022 | $4,469 | $338,923 | $76,814 | $262,109 |
| 2021 | $4,175 | $319,559 | $65,617 | $253,942 |
| 2020 | $3,989 | $316,284 | $64,945 | $251,339 |
| 2019 | $4,019 | $310,083 | $63,672 | $246,411 |
| 2018 | $3,881 | $304,004 | $62,424 | $241,580 |
| 2017 | $3,975 | $298,044 | $61,200 | $236,844 |
| 2016 | $3,426 | $292,200 | $60,000 | $232,200 |
| 2015 | $662 | $37,151 | $37,151 | $0 |
Property History
| Date | Event | Price | List to Sale | Price per Sq Ft |
|---|---|---|---|---|
| 12/05/2025 12/05/25 | For Sale | $520,000 | -- | $230 / Sq Ft |
Purchase History
| Date | Type | Sale Price | Title Company |
|---|---|---|---|
| Quit Claim Deed | $172,500 | Amrock Inc | |
| Interfamily Deed Transfer | -- | North American Title Concord | |
| Interfamily Deed Transfer | -- | North American Title Concord | |
| Grant Deed | $292,500 | North American Title Company |
Mortgage History
| Date | Status | Loan Amount | Loan Type |
|---|---|---|---|
| Previous Owner | $264,400 | New Conventional | |
| Previous Owner | $286,680 | FHA |
Source: Fresno MLS
MLS Number: 640665
APN: 312-871-10
Disclaimer: Certain information contained herein is derived from information provided by parties other than Homes.com. All information provided is deemed reliable, but is not guaranteed to be accurate and should be independently verified.
![]() IDX information is provided exclusively for personal, non-commercial use, and may not be used for any purpose other than to identify prospective properties consumers may be interested in purchasing. Information is deemed reliable but not guaranteed.
IDX information is provided exclusively for personal, non-commercial use, and may not be used for any purpose other than to identify prospective properties consumers may be interested in purchasing. Information is deemed reliable but not guaranteed.
- 5114 W Harvard Ave
- 2969 N Dante Ave
- 5109 W Clinton Ave
- 4765 W Shields Ave
- 4667 W Amherst Ave
- 4694 W Shields Ave
- 2566 N Antioch Ave
- 2457 N Milburn Ave
- 3292 N Wheeler Ave
- 5323 W Garland Ave
- 4657 W Berkeley Ave
- 3340 N Dante Ave
- 5866 W Shields Ave
- 3125 N Milburn Ave
- 3129 N Milburn Ave
- 5375 W Ramona Ave
- 5958 W Austin Way
- 2393 N Blythe Ave
- 1976 N Belvedere Ave
- 5443 W Flint Way
- 4275 W Harvard Ave
- 3656 W Harvard Ave
- 5462 W Holland Ave
- 4498 N Cornelia Ave
- 4607 N Casey Ave
- 4144 N Valentine Ave
- 2130 N Marks Ave
- 3025 W Pontiac Way
- 3158 W Austin Way Unit 102
- 4629 N Charles Ave Unit 102
- 4290 W San Jose Ave
- 3515 W San Jose Ave
- 5220 N Brawley Ave
- 5555 N Dante Ave
- 5350 N Brawley Ave
- 5490 N Salinas Ave
- 5473 N Salinas Ave
- 5150 N Valentine Ave
- 5537 N Gates Ave
- 1528 W Cortland Ave