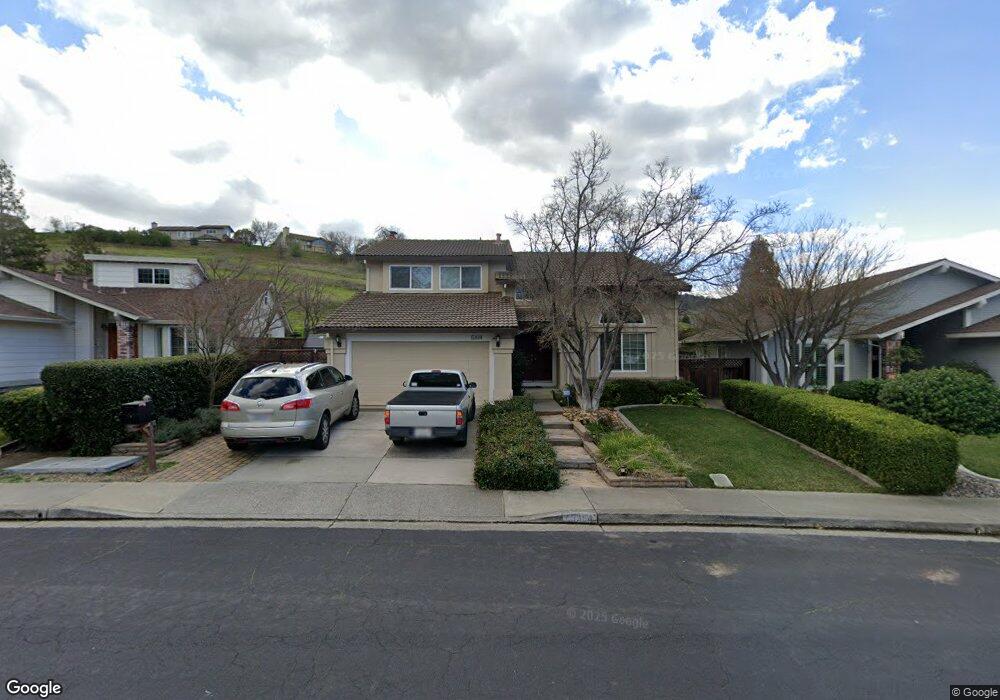
5304 Paso Del Rio Way Concord, CA 94521
The Highlands NeighborhoodEstimated Value: $1,060,000 - $1,161,000
4
Beds
3
Baths
2,135
Sq Ft
$511/Sq Ft
Est. Value
About This Home
This home is located at 5304 Paso Del Rio Way, Concord, CA 94521 and is currently estimated at $1,090,372, approximately $510 per square foot. 5304 Paso Del Rio Way is a home located in Contra Costa County with nearby schools including Highlands Elementary School, Mt. Diablo Elementary School, and Pine Hollow Middle School.
Ownership History
Date
Name
Owned For
Owner Type
Purchase Details
Closed on
Dec 4, 2023
Sold by
Brooks Anthony and Brooks Carol N
Bought by
Brooks 2023 Living Trust and Brooks
Current Estimated Value
Purchase Details
Closed on
Oct 9, 2018
Sold by
Malby Douglas C and Malby Robin L
Bought by
Brooks Anthony and Brooks Carol N
Home Financials for this Owner
Home Financials are based on the most recent Mortgage that was taken out on this home.
Original Mortgage
$636,000
Interest Rate
4.5%
Mortgage Type
New Conventional
Purchase Details
Closed on
May 7, 2007
Sold by
Malby Douglas C and Malby Robin Lynda
Bought by
Malby Douglas C and Malby Robin L
Create a Home Valuation Report for This Property
The Home Valuation Report is an in-depth analysis detailing your home's value as well as a comparison with similar homes in the area
Home Values in the Area
Average Home Value in this Area
Purchase History
| Date | Buyer | Sale Price | Title Company |
|---|---|---|---|
| Brooks 2023 Living Trust | -- | None Listed On Document | |
| Brooks Anthony | $795,000 | Chicago Title Company | |
| Malby Douglas C | -- | None Available |
Source: Public Records
Mortgage History
| Date | Status | Borrower | Loan Amount |
|---|---|---|---|
| Previous Owner | Brooks Anthony | $636,000 |
Source: Public Records
Tax History Compared to Growth
Tax History
| Year | Tax Paid | Tax Assessment Tax Assessment Total Assessment is a certain percentage of the fair market value that is determined by local assessors to be the total taxable value of land and additions on the property. | Land | Improvement |
|---|---|---|---|---|
| 2025 | $10,712 | $886,833 | $501,981 | $384,852 |
| 2024 | $10,526 | $869,445 | $492,139 | $377,306 |
| 2023 | $10,526 | $852,398 | $482,490 | $369,908 |
| 2022 | $10,401 | $835,685 | $473,030 | $362,655 |
| 2021 | $10,161 | $819,300 | $463,755 | $355,545 |
| 2019 | $9,980 | $795,000 | $450,000 | $345,000 |
| 2018 | $3,966 | $279,520 | $75,242 | $204,278 |
| 2017 | $3,829 | $274,040 | $73,767 | $200,273 |
| 2016 | $3,709 | $268,668 | $72,321 | $196,347 |
| 2015 | $3,648 | $264,633 | $71,235 | $193,398 |
| 2014 | $3,568 | $259,450 | $69,840 | $189,610 |
Source: Public Records
Map
Nearby Homes
- 1116 Vista Point Ln
- 5485 Florida Dr
- 1271 Kentucky Dr
- 1288 Kentucky Dr
- 1152 Via Doble
- 1012 Barkwood Ct
- 1120 Kenwal Rd Unit C
- 5350 Fernbank Dr Unit 1
- 1370 Washington Blvd
- 5503 Nebraska Dr
- 5501 Nebraska Dr
- 1395 Kenwal Rd Unit A
- 5391 Fernbank Dr
- 5506 Alaska Dr
- 5540 Michigan Blvd
- 5549 Pennsylvania Blvd
- 1015 Hidden Oak Ct
- 995 Rosehedge Ct
- 1341 Maryland Dr
- 868 Deer Spring Cir
- 5302 Paso Del Rio Way
- 5306 Paso Del Rio Way
- 5300 Paso Del Rio Way
- 5308 Paso Del Rio Way
- 5303 Paso Del Rio Way
- 5305 Paso Del Rio Way
- 1150 Discovery Way
- 5301 Paso Del Rio Way
- 5310 Paso Del Rio Way
- 5307 Paso Del Rio Way
- 1148 Discovery Way
- 5309 Paso Del Rio Way
- 5312 Paso Del Rio Way
- 1153 Discovery Way
- 1155 Discovery Way
- 1157 Discovery Way
- 1146 Discovery Way
- 1151 Discovery Way
- 5311 Paso Del Rio Way
- 5359 Grasswood Cir