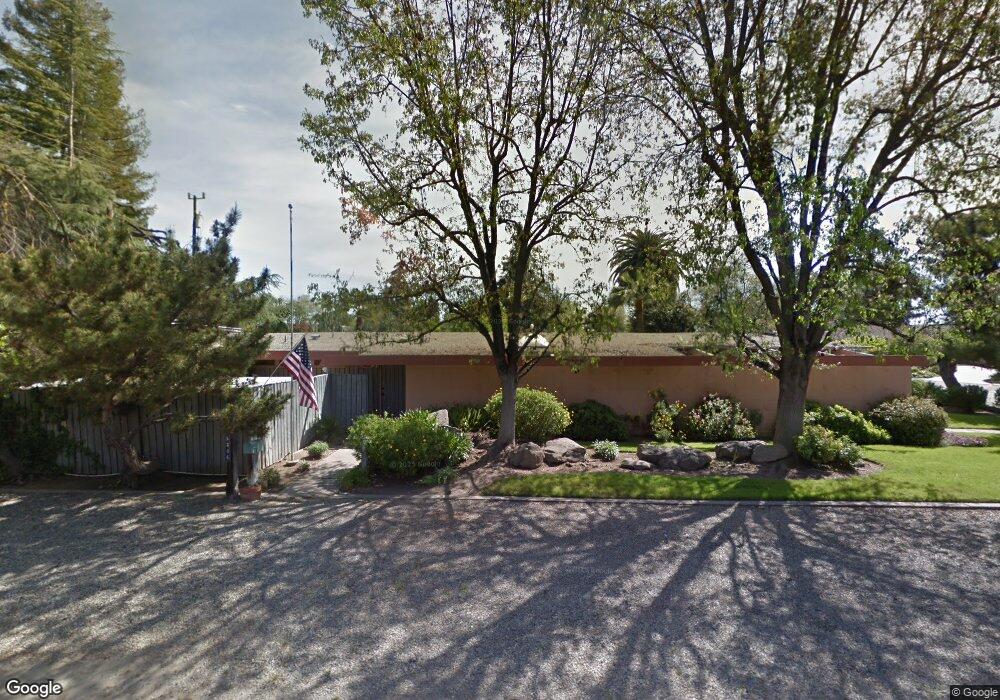
5306 N Sequoia Ave Fresno, CA 93711
Van Ness Extension NeighborhoodEstimated Value: $552,000 - $638,000
2
Beds
2
Baths
1,939
Sq Ft
$299/Sq Ft
Est. Value
About This Home
This home is located at 5306 N Sequoia Ave, Fresno, CA 93711 and is currently estimated at $579,885, approximately $299 per square foot. 5306 N Sequoia Ave is a home located in Fresno County with nearby schools including Malloch Elementary School, Tenaya Middle School, and Bullard High School.
Ownership History
Date
Name
Owned For
Owner Type
Purchase Details
Closed on
Oct 30, 2024
Sold by
Fargason Tamara S
Bought by
Tamara S Fargason 2024 Revocable Trust and Fargason
Current Estimated Value
Purchase Details
Closed on
Jun 24, 2024
Sold by
Charles And Noreen Mcbrien Family Trust and Mcbrien James E
Bought by
Wilfred J Mcfeeters And Victoria T Mcfeeters and Mcfeeters
Purchase Details
Closed on
Dec 12, 2018
Sold by
Mcbrien C S and Mcbrien Noreen
Bought by
Mcbrien Charkes Sprague and Mcbrien Noreen Margaret
Purchase Details
Closed on
Apr 30, 2018
Sold by
Mcbrien Charles S and Mcbrien Noreen M
Bought by
Mcbrien Charles S and Mcbrien Noreen M
Home Financials for this Owner
Home Financials are based on the most recent Mortgage that was taken out on this home.
Original Mortgage
$502,500
Interest Rate
4.77%
Mortgage Type
Reverse Mortgage Home Equity Conversion Mortgage
Create a Home Valuation Report for This Property
The Home Valuation Report is an in-depth analysis detailing your home's value as well as a comparison with similar homes in the area
Home Values in the Area
Average Home Value in this Area
Purchase History
| Date | Buyer | Sale Price | Title Company |
|---|---|---|---|
| Tamara S Fargason 2024 Revocable Trust | -- | None Listed On Document | |
| Wilfred J Mcfeeters And Victoria T Mcfeeters | $539,000 | Chicago Title | |
| 2024 Trust | -- | Chicago Title | |
| Mcbrien Charkes Sprague | -- | None Available | |
| Mcbrien Charles S | -- | Chicago Title Company |
Source: Public Records
Mortgage History
| Date | Status | Borrower | Loan Amount |
|---|---|---|---|
| Previous Owner | Mcbrien Charles S | $502,500 |
Source: Public Records
Tax History Compared to Growth
Tax History
| Year | Tax Paid | Tax Assessment Tax Assessment Total Assessment is a certain percentage of the fair market value that is determined by local assessors to be the total taxable value of land and additions on the property. | Land | Improvement |
|---|---|---|---|---|
| 2025 | $1,586 | $538,700 | $200,000 | $338,700 |
| 2023 | $1,554 | $130,734 | $27,727 | $103,007 |
| 2022 | $1,532 | $128,172 | $27,184 | $100,988 |
| 2021 | $1,488 | $125,659 | $26,651 | $99,008 |
| 2020 | $1,481 | $124,371 | $26,378 | $97,993 |
| 2019 | $1,422 | $121,933 | $25,861 | $96,072 |
| 2018 | $1,390 | $119,543 | $25,354 | $94,189 |
| 2017 | $1,364 | $117,200 | $24,857 | $92,343 |
| 2016 | $1,318 | $114,903 | $24,370 | $90,533 |
| 2015 | $1,296 | $113,178 | $24,004 | $89,174 |
| 2014 | $1,268 | $110,962 | $23,534 | $87,428 |
Source: Public Records
Map
Nearby Homes
- 5287 N Sequoia Dr
- 5375 N Forkner Ave
- 2190 W Via Cipressi
- 2059 W Barstow Ave
- 2044 W San Bruno Ave
- 5125 N Via Amore
- 5088 N Forkner Ave
- 5072 N Forkner Ave
- 5284 N Pleasant Ave
- 5039 N Van Ness Blvd
- 5124 N Via Trevi
- 2553 W Scott Ave
- 1720 W Barstow Ave
- 5649 N Romeo Ln
- 5180 N Channing Way
- 1685 W Robinwood Ln
- 4914 N Sequoia Dr
- 5630 N El Adobe Dr
- 2013 W Fairmont Ave
- 4880 N Hulbert Ave Unit 101
- 5306 N Sequoia Dr
- 2285 W San Madele Ave
- 5274 N Sequoia Ave
- 5288 N Parrish Way
- 5333 N Parrish Way
- 5300 N Parrish Way
- 5315 N Sequoia Ave
- 5331 N Sequoia Ave
- 5287 N Sequoia Ave
- 5312 N Parrish Way
- 5250 N Sequoia Ave
- 5330 N Parrish Way
- 2270 W San Madele Ave
- 5349 N Sequoia Ave
- 5239 N Bryn Mawr Dr
- 5267 N Sequoia Ave
- 5261 N Bryn Mawr Dr
- 2252 W San Madele Ave
- 2291 W Barstow Ave
- 5301 N Forkner Ave