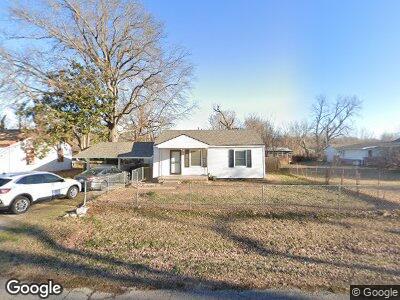
5307 W 2nd St Tulsa, OK 74127
Bruner NeighborhoodEstimated Value: $43,000 - $122,000
2
Beds
1
Bath
768
Sq Ft
$107/Sq Ft
Est. Value
About This Home
This home is located at 5307 W 2nd St, Tulsa, OK 74127 and is currently estimated at $82,136, approximately $106 per square foot. 5307 W 2nd St is a home located in Tulsa County with nearby schools including Wayman Tisdale Fine Arts Academy, Central Middle School, and Central Junior High School.
Ownership History
Date
Name
Owned For
Owner Type
Purchase Details
Closed on
Aug 21, 2024
Sold by
Flood Shelly D and Flood Charlotte
Bought by
Corsair Group Llc
Current Estimated Value
Home Financials for this Owner
Home Financials are based on the most recent Mortgage that was taken out on this home.
Original Mortgage
$75,600
Interest Rate
6.89%
Mortgage Type
Construction
Purchase Details
Closed on
May 22, 2012
Sold by
Dearman Sheree M and Dearman James
Bought by
Flood Shelly D
Home Financials for this Owner
Home Financials are based on the most recent Mortgage that was taken out on this home.
Original Mortgage
$43,800
Interest Rate
3.93%
Mortgage Type
New Conventional
Purchase Details
Closed on
Oct 24, 2007
Sold by
Carrico Sheree M
Bought by
Flood Shelly D
Purchase Details
Closed on
Oct 8, 1999
Sold by
Osborn Grace and Portillos Grace
Bought by
Carrico Sherry M and Flood Shelley D
Home Financials for this Owner
Home Financials are based on the most recent Mortgage that was taken out on this home.
Original Mortgage
$47,961
Interest Rate
7.86%
Mortgage Type
FHA
Create a Home Valuation Report for This Property
The Home Valuation Report is an in-depth analysis detailing your home's value as well as a comparison with similar homes in the area
Home Values in the Area
Average Home Value in this Area
Purchase History
| Date | Buyer | Sale Price | Title Company |
|---|---|---|---|
| Corsair Group Llc | $40,000 | Empire Title Company Ltd | |
| Flood Shelly D | -- | None Available | |
| Flood Shelly D | -- | None Available | |
| Carrico Sherry M | $48,000 | Tulsa Abstract & Title Co |
Source: Public Records
Mortgage History
| Date | Status | Borrower | Loan Amount |
|---|---|---|---|
| Open | Corsair Group Llc | $86,800 | |
| Closed | Corsair Group Llc | $75,600 | |
| Previous Owner | Flood Shelly D | $43,800 | |
| Previous Owner | Carrico Sherry M | $47,961 |
Source: Public Records
Tax History Compared to Growth
Tax History
| Year | Tax Paid | Tax Assessment Tax Assessment Total Assessment is a certain percentage of the fair market value that is determined by local assessors to be the total taxable value of land and additions on the property. | Land | Improvement |
|---|---|---|---|---|
| 2024 | $134 | $7,444 | $1,205 | $6,239 |
| 2023 | $791 | $7,090 | $1,148 | $5,942 |
| 2022 | $65 | $6,752 | $1,312 | $5,440 |
| 2021 | $72 | $6,430 | $1,249 | $5,181 |
| 2020 | $582 | $5,178 | $1,006 | $4,172 |
| 2019 | $574 | $4,998 | $971 | $4,027 |
| 2018 | $556 | $4,823 | $937 | $3,886 |
| 2017 | $595 | $5,653 | $1,098 | $4,555 |
| 2016 | $562 | $5,489 | $1,144 | $4,345 |
| 2015 | $568 | $5,489 | $1,144 | $4,345 |
| 2014 | $568 | $5,489 | $1,144 | $4,345 |
Source: Public Records
Map
Nearby Homes
- 5330 W 2nd St
- 5114 W 3rd St
- 1515 N 53rd Ave W
- 1524 N 53rd Ave W
- 305 N 53rd Ave W
- 310 S 49th Ave W
- 5137 W 6th St
- 610 S 53rd Ave W
- 111 N 47th Ave W
- 7764 Charles Page Blvd
- 4435 W 1st St
- 829 S 54th Ave W
- 120 N 46th Ave W
- 519 S 46th Ave W
- 5108 W 10th St
- 4732 W 8th St
- 4542 W 8th St
- 233 N 44th Ave W
- 1126 S 53rd Ave W
- 333 S 57th Ave W
- 5307 W 2nd St
- 5313 W 2nd St
- 118 S 53rd West Ave
- 5316 W 1st St
- 5317 W 2nd St
- 5312 W 1st St
- 5322 W 1st St
- 5306 W 2nd St
- 5312 W 2nd St
- 5306 W 1st St
- 5325 W 2nd St
- 129 S 53rd West Ave
- 5318 W 2nd St
- 5328 W 1st St
- 5324 W 2nd St
- 5336 W 1st St
- 119 S 53rd West Ave
- 115 S 53rd West Ave
- 5331 W 2nd St
- 123 S 53rd West Ave