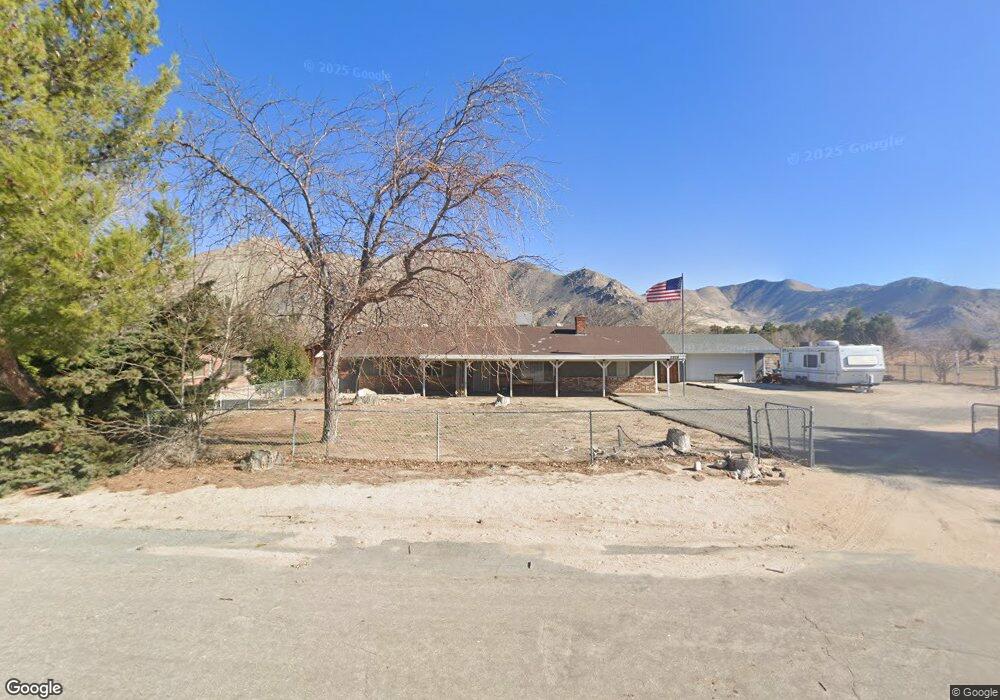
5308 Robin St Weldon, CA 93283
Estimated Value: $175,000 - $313,000
2
Beds
2
Baths
1,204
Sq Ft
$210/Sq Ft
Est. Value
About This Home
This home is located at 5308 Robin St, Weldon, CA 93283 and is currently estimated at $252,724, approximately $209 per square foot. 5308 Robin St is a home located in Kern County with nearby schools including South Fork Elementary School and Kern Valley High School.
Ownership History
Date
Name
Owned For
Owner Type
Purchase Details
Closed on
Nov 27, 2006
Sold by
Thomey Charles Randall and Thomey Tiffany Riley
Bought by
Randall Charles and Thomey Tiffany Riley
Current Estimated Value
Purchase Details
Closed on
Sep 23, 2005
Sold by
Passarelli Brian C and Estate Of Marion Louise Passar
Bought by
Thomey Charles Randall and Riley Tiffany Jean
Home Financials for this Owner
Home Financials are based on the most recent Mortgage that was taken out on this home.
Original Mortgage
$128,000
Outstanding Balance
$68,049
Interest Rate
5.75%
Mortgage Type
Purchase Money Mortgage
Estimated Equity
$184,675
Create a Home Valuation Report for This Property
The Home Valuation Report is an in-depth analysis detailing your home's value as well as a comparison with similar homes in the area
Home Values in the Area
Average Home Value in this Area
Purchase History
| Date | Buyer | Sale Price | Title Company |
|---|---|---|---|
| Randall Charles | -- | Fidelity National Title Co | |
| Thomey Charles Randall | $160,000 | Fidelity Title |
Source: Public Records
Mortgage History
| Date | Status | Borrower | Loan Amount |
|---|---|---|---|
| Open | Thomey Charles Randall | $128,000 |
Source: Public Records
Tax History
| Year | Tax Paid | Tax Assessment Tax Assessment Total Assessment is a certain percentage of the fair market value that is determined by local assessors to be the total taxable value of land and additions on the property. | Land | Improvement |
|---|---|---|---|---|
| 2025 | $2,566 | $218,632 | $54,652 | $163,980 |
| 2024 | $2,496 | $214,346 | $53,581 | $160,765 |
| 2023 | $2,496 | $210,144 | $52,531 | $157,613 |
| 2022 | $2,455 | $206,024 | $51,501 | $154,523 |
| 2021 | $2,370 | $201,986 | $50,492 | $151,494 |
| 2020 | $2,329 | $199,916 | $49,975 | $149,941 |
| 2019 | $2,286 | $199,916 | $49,975 | $149,941 |
| 2018 | $2,261 | $148,000 | $37,000 | $111,000 |
| 2017 | $1,660 | $138,000 | $35,000 | $103,000 |
| 2016 | $1,427 | $123,000 | $31,000 | $92,000 |
| 2015 | $1,360 | $116,000 | $29,000 | $87,000 |
| 2014 | $1,317 | $112,000 | $28,000 | $84,000 |
Source: Public Records
Map
Nearby Homes
- 5309 Marjorie St
- 0 Na Unit 202602526
- 15310023 Kelso Valley Rd
- 425-072-61 Kelso Valley Rd
- 6165 Bonikell Ln
- 6200 Poplar St
- 14225 Polaris St
- 20530 Highway 178
- 15230 Tumbleweed
- 0 Vail Lane & Orsburn Ln
- 18220 California 178
- 0 Paul's Place Dr
- 11610 Longhorn Ln
- 4700 Cimarron Dr
- 5664 Piute Mountain Rd
- 5509 Isabel Dr
- 0 S Kelso Valley Rd
- 5651 Hooper Rd
- 5445 Bella Vista Dr
- 11023 Marcia St
- 5312 Robin St
- 5400 Robin St
- 5309 Estate Place
- 5301 Robin St
- 5405 Robin St
- 0 Roadrunner Rd Unit PI179267
- 0 Roadrunner Rd Unit PI189849
- 0 Roadrunner Rd Unit PI200548
- 5200 Robin St
- 5412 Robin St
- 5409 Estate Place
- 14371 Flanders St
- 5413 Robin St
- 14315 Tingle Ave
- 5251 Marjorie St
- 14209 Bass Ave
- 14217 Bass Ave
- 5412 Estate Place
- 14205 Bass Ave
- 14305 Bass Ave
Your Personal Tour Guide
Ask me questions while you tour the home.