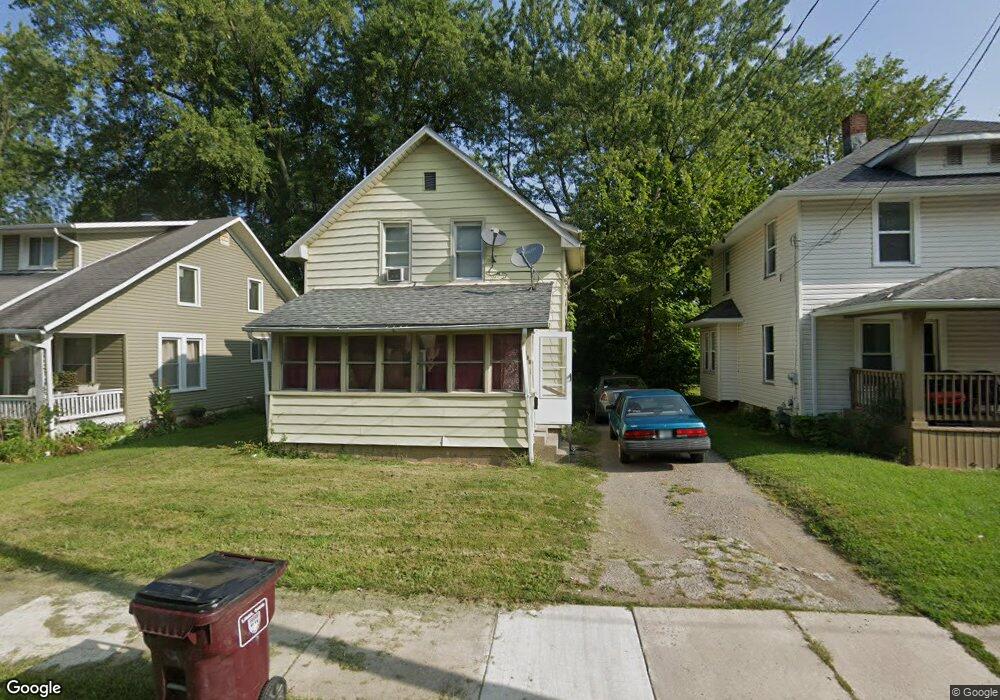
531 Catalpa Ave Lima, OH 45804
Southside Lima NeighborhoodEstimated Value: $44,000 - $104,000
3
Beds
1
Bath
1,029
Sq Ft
$65/Sq Ft
Est. Value
About This Home
This home is located at 531 Catalpa Ave, Lima, OH 45804 and is currently estimated at $66,667, approximately $64 per square foot. 531 Catalpa Ave is a home located in Allen County with nearby schools including Unity Elementary School, Lima North Middle School, and Lima West Middle School.
Ownership History
Date
Name
Owned For
Owner Type
Purchase Details
Closed on
Jun 27, 2018
Sold by
Lom Properties Llc
Bought by
Honey Run Investments Llc
Current Estimated Value
Home Financials for this Owner
Home Financials are based on the most recent Mortgage that was taken out on this home.
Original Mortgage
$75,000
Interest Rate
4.5%
Mortgage Type
Future Advance Clause Open End Mortgage
Purchase Details
Closed on
May 22, 2009
Sold by
Estelle Sadie M
Bought by
Lom Properties Llc
Purchase Details
Closed on
Feb 1, 1981
Bought by
Estelle Sadie M
Create a Home Valuation Report for This Property
The Home Valuation Report is an in-depth analysis detailing your home's value as well as a comparison with similar homes in the area
Home Values in the Area
Average Home Value in this Area
Purchase History
| Date | Buyer | Sale Price | Title Company |
|---|---|---|---|
| Honey Run Investments Llc | $85,000 | None Available | |
| Lom Properties Llc | $5,300 | Attorney | |
| Estelle Sadie M | -- | -- |
Source: Public Records
Mortgage History
| Date | Status | Borrower | Loan Amount |
|---|---|---|---|
| Open | Honey Run Investments Llc | $300,000 | |
| Open | Honey Run Investments Llc | $1,106,571 | |
| Closed | Honey Run Investments Llc | $75,000 | |
| Closed | Honey Run Investments Llc | $75,000 |
Source: Public Records
Tax History Compared to Growth
Tax History
| Year | Tax Paid | Tax Assessment Tax Assessment Total Assessment is a certain percentage of the fair market value that is determined by local assessors to be the total taxable value of land and additions on the property. | Land | Improvement |
|---|---|---|---|---|
| 2024 | $402 | $6,620 | $1,020 | $5,600 |
| 2023 | $320 | $6,300 | $980 | $5,320 |
| 2022 | $371 | $6,300 | $980 | $5,320 |
| 2021 | $387 | $6,300 | $980 | $5,320 |
| 2020 | $251 | $3,850 | $980 | $2,870 |
| 2019 | $251 | $3,850 | $980 | $2,870 |
| 2018 | $250 | $3,850 | $980 | $2,870 |
| 2017 | $252 | $3,850 | $980 | $2,870 |
| 2016 | $307 | $3,850 | $980 | $2,870 |
| 2015 | $305 | $3,850 | $980 | $2,870 |
| 2014 | $305 | $3,790 | $1,020 | $2,770 |
| 2013 | $546 | $9,880 | $1,020 | $8,860 |
Source: Public Records
Map
Nearby Homes
- 516 Catalpa Ave
- 639 E 4th St
- 640 E 4th St
- 1147 S Union St
- 1189 S Main St
- 839 Saint Johns Ave
- 1008 Fairview Ave
- 865 E 4th St
- 861 E 4th St
- 306 E Vine St
- 600 Dingledine Ave
- 1093 S Sugar St
- 706 E Kibby St
- 1900 Garland Ave
- 520 Orena Ave
- 380 S Pine St
- 785 Holly St
- 720 S Metcalf St
- 711 W Kibby St
- 00 Bellefontaine Ave