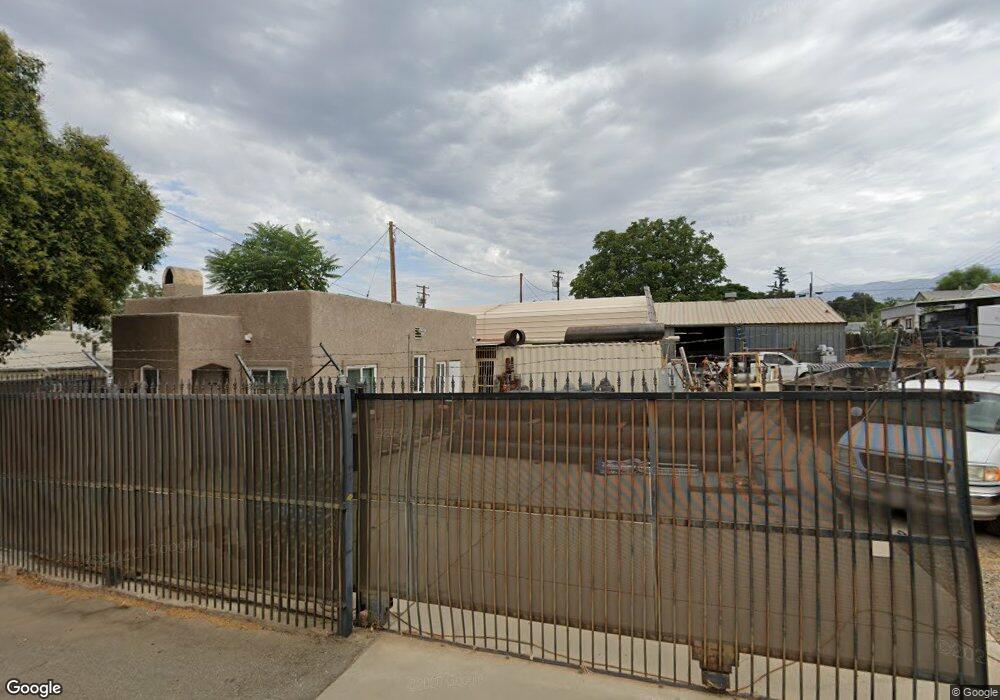
531 Edgar Ave Beaumont, CA 92223
Estimated Value: $443,526
Studio
--
Bath
1,290
Sq Ft
$344/Sq Ft
Est. Value
About This Home
This home is located at 531 Edgar Ave, Beaumont, CA 92223 and is currently estimated at $443,526, approximately $343 per square foot. 531 Edgar Ave is a home located in Riverside County with nearby schools including Three Rings Ranch Elementary School, Mountain View Middle School, and Beaumont Senior High School.
Ownership History
Date
Name
Owned For
Owner Type
Purchase Details
Closed on
Aug 21, 2017
Sold by
Rentz Michael T
Bought by
Rentz Michael T and Rentz Nichole C
Current Estimated Value
Purchase Details
Closed on
Jan 2, 2017
Sold by
Cash Stephen M and Cash Cynthia M
Bought by
Rentz Michael T
Home Financials for this Owner
Home Financials are based on the most recent Mortgage that was taken out on this home.
Original Mortgage
$197,000
Outstanding Balance
$161,927
Interest Rate
4.03%
Mortgage Type
Seller Take Back
Estimated Equity
$281,599
Purchase Details
Closed on
Aug 3, 2002
Sold by
Valenzuela Gabriel
Bought by
Cash Stephen M and Cash Cynthia M
Home Financials for this Owner
Home Financials are based on the most recent Mortgage that was taken out on this home.
Original Mortgage
$49,500
Interest Rate
6.16%
Mortgage Type
Purchase Money Mortgage
Purchase Details
Closed on
Dec 16, 1996
Sold by
Stokes Sally J
Bought by
California Inland Empire Council Inc
Create a Home Valuation Report for This Property
The Home Valuation Report is an in-depth analysis detailing your home's value as well as a comparison with similar homes in the area
Home Values in the Area
Average Home Value in this Area
Purchase History
| Date | Buyer | Sale Price | Title Company |
|---|---|---|---|
| Rentz Michael T | -- | None Available | |
| Rentz Michael T | $252,000 | First American Title Ins | |
| Cash Stephen M | $55,000 | Stewart Title | |
| California Inland Empire Council Inc | -- | Orange Coast Title |
Source: Public Records
Mortgage History
| Date | Status | Borrower | Loan Amount |
|---|---|---|---|
| Open | Rentz Michael T | $197,000 | |
| Previous Owner | Cash Stephen M | $49,500 |
Source: Public Records
Tax History
| Year | Tax Paid | Tax Assessment Tax Assessment Total Assessment is a certain percentage of the fair market value that is determined by local assessors to be the total taxable value of land and additions on the property. | Land | Improvement |
|---|---|---|---|---|
| 2025 | $3,792 | $292,461 | $135,785 | $156,676 |
| 2023 | $3,792 | $281,106 | $130,513 | $150,593 |
| 2022 | $3,734 | $275,595 | $127,954 | $147,641 |
| 2021 | $3,663 | $270,193 | $125,446 | $144,747 |
| 2020 | $3,625 | $267,423 | $124,160 | $143,263 |
| 2019 | $3,569 | $262,180 | $121,726 | $140,454 |
| 2018 | $3,547 | $257,040 | $119,340 | $137,700 |
| 2017 | $1,074 | $74,606 | $39,921 | $34,685 |
| 2016 | $1,046 | $73,144 | $39,139 | $34,005 |
| 2015 | $1,028 | $72,048 | $38,552 | $33,496 |
| 2014 | $1,029 | $70,639 | $37,798 | $32,841 |
Source: Public Records
Map
Nearby Homes
- 207 E 5th St
- 559 Edgar Ave Unit A2-282
- 737 Edgar Ave
- 677 Magnolia Ave
- 801 Elm Ave
- 0 Veile Ave
- 525 Palm Ave Unit 30
- 925 Magnolia Ave
- 1049 Beaumont Ave
- 410 Windfields Way
- 926 Hardwick Ave
- 734 Massachusetts Ave
- 612 Pennsylvania Ave
- 1185 Orange Ave
- 150 E 12th St
- 1257 E 6th St
- 370 W 12th St
- 1168 Palm Ave
- 1153 Woodburn Cir
- 696 Illinois Ave
- 172 E 5th St
- 559 Edgar Ave
- 174 E 5th St
- 521 Edgar Ave
- 520 Edgar Ave
- 552 N California Ave
- 516 N California Ave
- 530 Edgar Ave
- 540 Edgar Ave
- 550 Edgar Ave
- 141 E 6th St
- 580 Edgar Ave
- 580 N California Ave
- 125 E 6th St
- 514 N California Ave
- 514 N California Ave
- 225 E 6th St
- 235 E 6th St
- 233 E 5th St
- 545 Euclid Ave
Your Personal Tour Guide
Ask me questions while you tour the home.