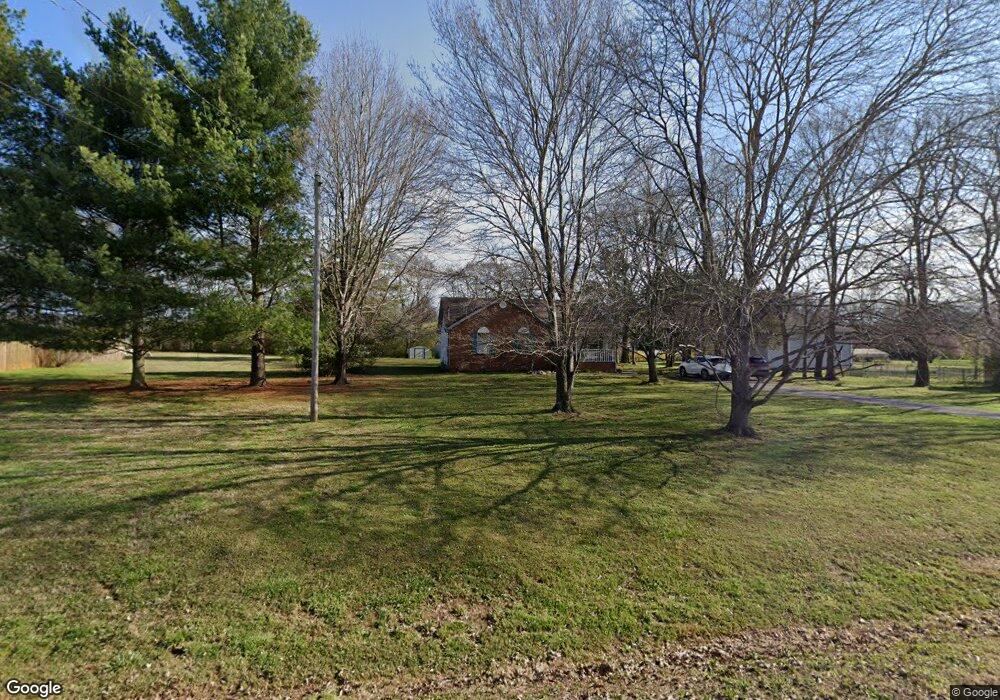
5310 Grassland Dr Murfreesboro, TN 37129
Estimated Value: $294,091 - $364,000
--
Bed
2
Baths
1,153
Sq Ft
$283/Sq Ft
Est. Value
About This Home
This home is located at 5310 Grassland Dr, Murfreesboro, TN 37129 and is currently estimated at $325,773, approximately $282 per square foot. 5310 Grassland Dr is a home located in Rutherford County with nearby schools including Brown's Chapel Elementary School, Blackman Middle School, and Blackman High School.
Ownership History
Date
Name
Owned For
Owner Type
Purchase Details
Closed on
Dec 12, 2003
Sold by
H U D
Bought by
Michelle Prior Lisa
Current Estimated Value
Home Financials for this Owner
Home Financials are based on the most recent Mortgage that was taken out on this home.
Original Mortgage
$85,000
Outstanding Balance
$42,276
Interest Rate
5.98%
Estimated Equity
$283,497
Purchase Details
Closed on
Sep 16, 2003
Sold by
Lowrance Brandon M and Lowrance Deann
Bought by
Hud
Purchase Details
Closed on
Sep 7, 2000
Sold by
Greenwood Michael S
Bought by
Lowrance Brandon M and Lowrance Deann
Purchase Details
Closed on
Oct 2, 1997
Sold by
Christopher Garner
Bought by
Greenwood Michael S and Greenwood Hea
Home Financials for this Owner
Home Financials are based on the most recent Mortgage that was taken out on this home.
Original Mortgage
$79,908
Interest Rate
7.6%
Create a Home Valuation Report for This Property
The Home Valuation Report is an in-depth analysis detailing your home's value as well as a comparison with similar homes in the area
Home Values in the Area
Average Home Value in this Area
Purchase History
| Date | Buyer | Sale Price | Title Company |
|---|---|---|---|
| Michelle Prior Lisa | $85,000 | -- | |
| Hud | $106,116 | -- | |
| Lowrance Brandon M | $95,000 | -- | |
| Greenwood Michael S | $79,950 | -- |
Source: Public Records
Mortgage History
| Date | Status | Borrower | Loan Amount |
|---|---|---|---|
| Open | Greenwood Michael S | $85,000 | |
| Previous Owner | Greenwood Michael S | $79,908 |
Source: Public Records
Tax History Compared to Growth
Tax History
| Year | Tax Paid | Tax Assessment Tax Assessment Total Assessment is a certain percentage of the fair market value that is determined by local assessors to be the total taxable value of land and additions on the property. | Land | Improvement |
|---|---|---|---|---|
| 2025 | $1,047 | $55,788 | $13,750 | $42,038 |
| 2024 | $1,047 | $55,788 | $13,750 | $42,038 |
| 2023 | $1,047 | $55,788 | $13,750 | $42,038 |
| 2022 | $902 | $55,788 | $13,750 | $42,038 |
| 2021 | $854 | $38,488 | $8,125 | $30,363 |
| 2020 | $854 | $38,488 | $8,125 | $30,363 |
| 2019 | $854 | $38,488 | $8,125 | $30,363 |
| 2018 | $808 | $38,488 | $0 | $0 |
| 2017 | $706 | $26,325 | $0 | $0 |
| 2016 | $706 | $26,325 | $0 | $0 |
| 2015 | $706 | $26,325 | $0 | $0 |
| 2014 | $655 | $26,325 | $0 | $0 |
| 2013 | -- | $23,575 | $0 | $0 |
Source: Public Records
Map
Nearby Homes
- 5302 Grassland Dr
- 5342 Keystone Ct
- 4343 Banks St
- 5132 Prickly Pine Place
- 5064 Tricia Place
- 4921 Camborne Cir
- 4913 Camborne Cir
- 2853 Elijah Dr
- 4946 Camborne Cir
- 2816 Lightning Bug Dr
- 3033 Asbury Rd
- Esparza Plan at Masonbrooke
- Lockhart Plan at Masonbrooke
- Seguin Plan at Masonbrooke
- Kimble Plan at Masonbrooke
- 416 Heatherwood Dr
- 507 Heatherwood Dr
- 5227 Nancy Seward Dr
- 4606 Turquoise Ln
- 4936 Laura Jeanne Blvd
- 5306 Grassland Dr
- 5314 Grassland Dr
- 5253 Sallee Dr
- 5309 Grassland Dr
- 5250 Grassland Dr
- 5247 Sallee Dr
- 5303 Grassland Dr
- 5315 Grassland Dr
- 5321 Grassland Dr
- 5248 Sallee Dr
- 5239 Sallee Dr
- 5244 Grassland Dr
- 5326 Grassland Dr
- 5242 Sallee Dr
- 5252 Sallee Dr
- 5327 Grassland Dr
- 5310 Keystone Ct
- 5241 Grassland Dr
- 4409 Windover St
- 5240 Grassland Dr