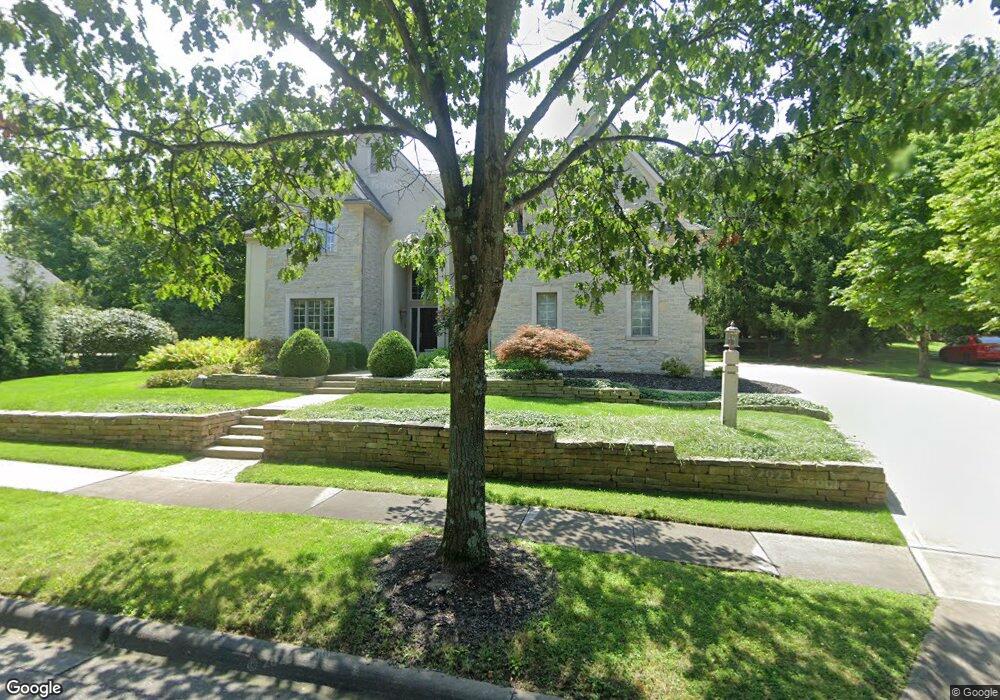
5311 Reserve Dr Dublin, OH 43017
Estimated Value: $980,000 - $1,365,000
5
Beds
6
Baths
4,489
Sq Ft
$248/Sq Ft
Est. Value
About This Home
This home is located at 5311 Reserve Dr, Dublin, OH 43017 and is currently estimated at $1,112,021, approximately $247 per square foot. 5311 Reserve Dr is a home located in Franklin County with nearby schools including Mary Emma Bailey Elementary School, Willard Grizzell Middle School, and Dublin Jerome High School.
Ownership History
Date
Name
Owned For
Owner Type
Purchase Details
Closed on
Apr 22, 2003
Sold by
Cendant Mobility Financial Corp
Bought by
Brown Douglas W and Brown Karen M
Current Estimated Value
Home Financials for this Owner
Home Financials are based on the most recent Mortgage that was taken out on this home.
Original Mortgage
$492,800
Outstanding Balance
$166,036
Interest Rate
3.25%
Estimated Equity
$945,985
Purchase Details
Closed on
Dec 31, 2002
Sold by
Burton James A and Burton Georgeann
Bought by
Cendant Mobility Financial Corp
Purchase Details
Closed on
Oct 15, 1997
Sold by
Turner Alfred M and Turner Patricia G
Bought by
Burton James A and Burton Georgeann
Home Financials for this Owner
Home Financials are based on the most recent Mortgage that was taken out on this home.
Original Mortgage
$420,000
Interest Rate
7.65%
Purchase Details
Closed on
Jun 21, 1994
Sold by
Bob Webb Builders Inc
Bought by
Turner Alfred M and Turner Patricia G
Create a Home Valuation Report for This Property
The Home Valuation Report is an in-depth analysis detailing your home's value as well as a comparison with similar homes in the area
Home Values in the Area
Average Home Value in this Area
Purchase History
| Date | Buyer | Sale Price | Title Company |
|---|---|---|---|
| Brown Douglas W | $616,000 | The Midland Celtic Title Gro | |
| Cendant Mobility Financial Corp | $637,500 | The Midland Celtic Title Gro | |
| Burton James A | $547,000 | Franklin Abstract | |
| Turner Alfred M | $115,000 | -- |
Source: Public Records
Mortgage History
| Date | Status | Borrower | Loan Amount |
|---|---|---|---|
| Open | Brown Douglas W | $492,800 | |
| Previous Owner | Burton James A | $420,000 |
Source: Public Records
Tax History
| Year | Tax Paid | Tax Assessment Tax Assessment Total Assessment is a certain percentage of the fair market value that is determined by local assessors to be the total taxable value of land and additions on the property. | Land | Improvement |
|---|---|---|---|---|
| 2025 | $18,581 | $285,990 | $47,250 | $238,740 |
| 2024 | $18,581 | $285,990 | $47,250 | $238,740 |
| 2023 | $18,323 | $285,985 | $47,250 | $238,735 |
| 2022 | $28,950 | $275,140 | $28,880 | $246,260 |
| 2021 | $19,332 | $275,140 | $28,880 | $246,260 |
| 2020 | $19,492 | $275,140 | $28,880 | $246,260 |
| 2019 | $20,000 | $249,690 | $26,250 | $223,440 |
| 2018 | $18,863 | $249,690 | $26,250 | $223,440 |
| 2017 | $18,613 | $249,690 | $26,250 | $223,440 |
| 2016 | $17,526 | $220,750 | $39,800 | $180,950 |
| 2015 | $17,639 | $220,750 | $39,800 | $180,950 |
| 2014 | $17,661 | $220,750 | $39,800 | $180,950 |
| 2013 | $8,559 | $210,245 | $37,905 | $172,340 |
Source: Public Records
Map
Nearby Homes
- 8613 Kirkhill Ct
- 5119 Reserve Dr
- 5250 Indian Hill Rd
- 5195 River Forest Rd
- 8565 Dunsinane Dr
- 8455 Dunsinane Dr
- 5515 Aryshire Ct Unit 23
- 10900 Buckingham Place
- 10669 Riverside Dr
- 4977 Dunkerrin Ct
- 5444 Stratford Ave
- 7830 Windwood Dr
- 5877 Tarton Cir S
- 6031 Cromdale Dr
- 7785 Kate Brown Dr
- 6050 Kentigern Ct S
- 0 Glick Rd Unit 225037914
- 9366 Muirkirk Dr
- 7886 Nassau Loop
- 7668 Brandbury Place
- 5297 Reserve Dr
- 5325 Reserve Dr
- 8443 Beeswing Ct
- 8565 Stonechat Loop
- 8427 Beeswing Ct
- 5283 Reserve Dr
- 8426 Beeswing Ct
- 8559 Stonechat Loop
- 8562 Stonechat Loop
- 8415 Beeswing Ct
- 8440 Arbory Hill Ct
- 5269 Reserve Dr
- 5368 Hawthornden Ct
- 5368 Hawthornden Ct Unit 1803
- 5356 Hawthornden Ct
- 5421 Reserve Dr
- 8418 Beeswing Ct
- 8553 Stonechat Loop
- 8556 Stonechat Loop
- 8428 Arbory Hill Ct
Your Personal Tour Guide
Ask me questions while you tour the home.