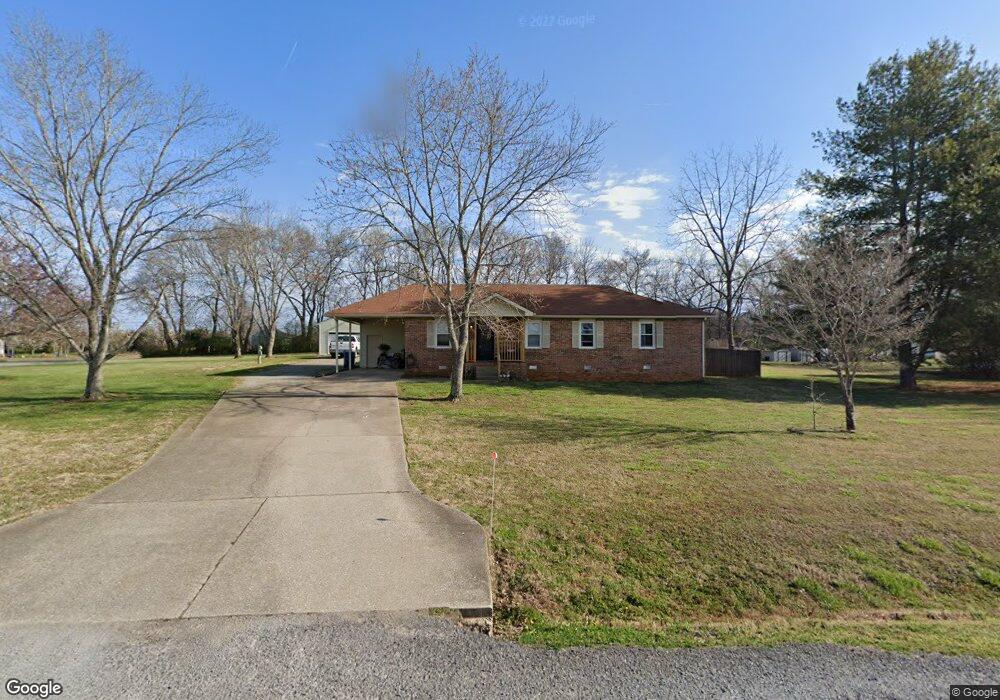
5314 Grassland Dr Murfreesboro, TN 37129
Estimated Value: $338,751 - $366,000
3
Beds
2
Baths
1,224
Sq Ft
$287/Sq Ft
Est. Value
About This Home
This home is located at 5314 Grassland Dr, Murfreesboro, TN 37129 and is currently estimated at $351,438, approximately $287 per square foot. 5314 Grassland Dr is a home located in Rutherford County with nearby schools including Brown's Chapel Elementary School, Blackman Middle School, and Blackman High School.
Ownership History
Date
Name
Owned For
Owner Type
Purchase Details
Closed on
Oct 5, 2020
Sold by
Myburgh Sonette and Pretoria Rentals Trust
Bought by
Sims Joseph S and Sims Jill S
Current Estimated Value
Home Financials for this Owner
Home Financials are based on the most recent Mortgage that was taken out on this home.
Original Mortgage
$245,014
Outstanding Balance
$217,927
Interest Rate
2.9%
Mortgage Type
VA
Estimated Equity
$133,511
Purchase Details
Closed on
Aug 28, 2008
Sold by
Federal National Mortgage Association
Bought by
Pretoria Rental Preservation T
Purchase Details
Closed on
Jul 3, 2008
Sold by
Watson Charles L
Bought by
Federal National Mortgage Asso
Purchase Details
Closed on
Mar 21, 2005
Sold by
Brown Thomas A
Bought by
Watson Charles L
Home Financials for this Owner
Home Financials are based on the most recent Mortgage that was taken out on this home.
Original Mortgage
$113,050
Interest Rate
5.57%
Purchase Details
Closed on
Jun 23, 1998
Sold by
Brent Glosson
Bought by
Brown Thomas A and Brown Jane
Create a Home Valuation Report for This Property
The Home Valuation Report is an in-depth analysis detailing your home's value as well as a comparison with similar homes in the area
Home Values in the Area
Average Home Value in this Area
Purchase History
| Date | Buyer | Sale Price | Title Company |
|---|---|---|---|
| Sims Joseph S | $236,500 | Watauga T&E Co Llc | |
| Pretoria Rental Preservation T | $112,000 | -- | |
| Federal National Mortgage Asso | $117,062 | -- | |
| Watson Charles L | $119,000 | -- | |
| Brown Thomas A | $96,000 | -- |
Source: Public Records
Mortgage History
| Date | Status | Borrower | Loan Amount |
|---|---|---|---|
| Open | Sims Joseph S | $245,014 | |
| Previous Owner | Brown Thomas A | $113,050 |
Source: Public Records
Tax History Compared to Growth
Tax History
| Year | Tax Paid | Tax Assessment Tax Assessment Total Assessment is a certain percentage of the fair market value that is determined by local assessors to be the total taxable value of land and additions on the property. | Land | Improvement |
|---|---|---|---|---|
| 2025 | $1,294 | $68,975 | $14,450 | $54,525 |
| 2024 | $1,294 | $68,975 | $14,450 | $54,525 |
| 2023 | $1,294 | $68,975 | $14,450 | $54,525 |
| 2022 | $1,115 | $68,975 | $14,450 | $54,525 |
| 2021 | $991 | $47,225 | $8,525 | $38,700 |
| 2020 | $1,048 | $47,225 | $8,525 | $38,700 |
| 2019 | $1,048 | $47,225 | $8,525 | $38,700 |
| 2018 | $991 | $47,225 | $0 | $0 |
| 2017 | $868 | $32,400 | $0 | $0 |
| 2016 | $868 | $32,400 | $0 | $0 |
| 2015 | $868 | $32,400 | $0 | $0 |
| 2014 | $806 | $32,400 | $0 | $0 |
| 2013 | -- | $29,425 | $0 | $0 |
Source: Public Records
Map
Nearby Homes
- 5302 Grassland Dr
- 5342 Keystone Ct
- 4343 Banks St
- 5132 Prickly Pine Place
- 5064 Tricia Place
- 2853 Elijah Dr
- 4921 Camborne Cir
- 4913 Camborne Cir
- 2816 Lightning Bug Dr
- 4946 Camborne Cir
- 416 Heatherwood Dr
- 3033 Asbury Rd
- 507 Heatherwood Dr
- 4606 Turquoise Ln
- Esparza Plan at Masonbrooke
- Lockhart Plan at Masonbrooke
- Seguin Plan at Masonbrooke
- Kimble Plan at Masonbrooke
- 228 Heatherwood Dr
- 5227 Nancy Seward Dr
- 5253 Sallee Dr
- 5310 Grassland Dr
- 5326 Grassland Dr
- 5321 Grassland Dr
- 5306 Grassland Dr
- 5315 Grassland Dr
- 5309 Grassland Dr
- 5327 Grassland Dr
- 4409 Windover St
- 5334 Grassland Dr
- 5252 Sallee Dr
- 5333 Grassland Dr
- 5303 Grassland Dr
- 5248 Sallee Dr
- 5307 Sallee Dr
- 5340 Grassland Dr
- 5247 Sallee Dr
- 5339 Grassland Dr
- 5250 Grassland Dr
- 5310 Keystone Ct