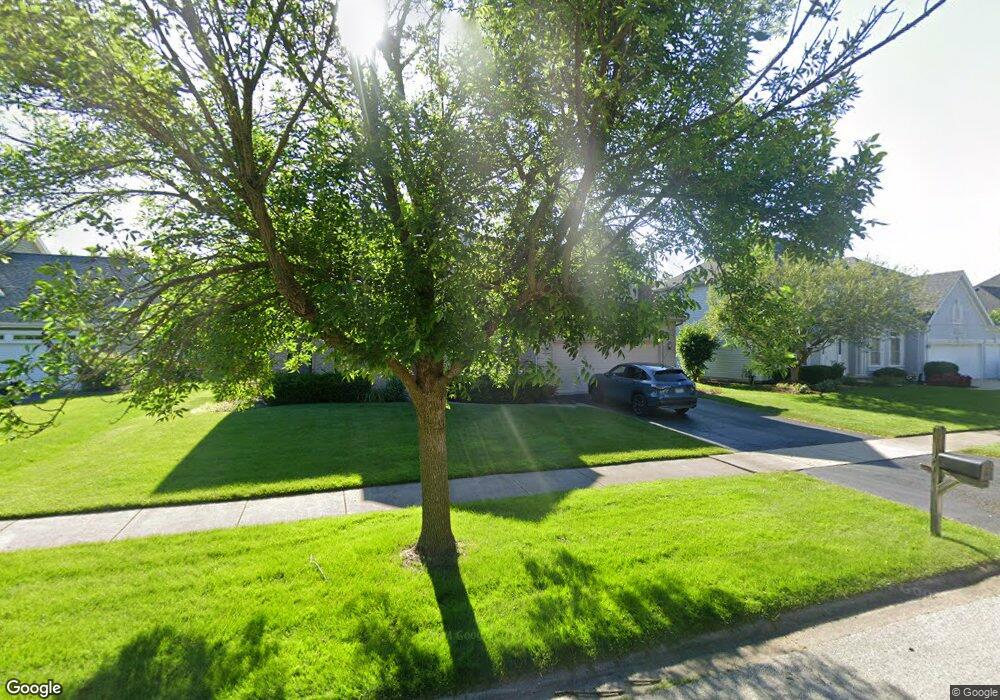
5315 Bundle Flower Ct Unit 11 Naperville, IL 60564
High Meadow NeighborhoodEstimated Value: $692,031 - $775,000
4
Beds
3
Baths
2,952
Sq Ft
$251/Sq Ft
Est. Value
About This Home
This home is located at 5315 Bundle Flower Ct Unit 11, Naperville, IL 60564 and is currently estimated at $741,258, approximately $251 per square foot. 5315 Bundle Flower Ct Unit 11 is a home located in Will County with nearby schools including Graham Elementary School, Clifford Crone Middle School, and Neuqua Valley High School.
Ownership History
Date
Name
Owned For
Owner Type
Purchase Details
Closed on
Aug 3, 2004
Sold by
Ditzel David S and Ditzel Amy L Houck
Bought by
Mutaly Huzefa and Mustaly Tasneem
Current Estimated Value
Home Financials for this Owner
Home Financials are based on the most recent Mortgage that was taken out on this home.
Original Mortgage
$180,000
Interest Rate
6.1%
Mortgage Type
Purchase Money Mortgage
Purchase Details
Closed on
Jun 27, 1997
Sold by
Claybridge Builders Inc
Bought by
Ditzel David S and Ditzel Amy L Houck
Home Financials for this Owner
Home Financials are based on the most recent Mortgage that was taken out on this home.
Original Mortgage
$261,000
Interest Rate
7.75%
Purchase Details
Closed on
Apr 16, 1997
Sold by
Harris Bank Naperville
Bought by
Claybridge Builders Inc
Home Financials for this Owner
Home Financials are based on the most recent Mortgage that was taken out on this home.
Original Mortgage
$21,000
Interest Rate
8.05%
Mortgage Type
Construction
Create a Home Valuation Report for This Property
The Home Valuation Report is an in-depth analysis detailing your home's value as well as a comparison with similar homes in the area
Home Values in the Area
Average Home Value in this Area
Purchase History
| Date | Buyer | Sale Price | Title Company |
|---|---|---|---|
| Mutaly Huzefa | $428,000 | First American Title | |
| Ditzel David S | $292,000 | -- | |
| Claybridge Builders Inc | $70,500 | -- |
Source: Public Records
Mortgage History
| Date | Status | Borrower | Loan Amount |
|---|---|---|---|
| Closed | Mutaly Huzefa | $180,000 | |
| Previous Owner | Ditzel David S | $261,000 | |
| Previous Owner | Claybridge Builders Inc | $21,000 |
Source: Public Records
Tax History Compared to Growth
Tax History
| Year | Tax Paid | Tax Assessment Tax Assessment Total Assessment is a certain percentage of the fair market value that is determined by local assessors to be the total taxable value of land and additions on the property. | Land | Improvement |
|---|---|---|---|---|
| 2024 | $12,855 | $204,257 | $52,673 | $151,584 |
| 2023 | $12,855 | $180,439 | $46,531 | $133,908 |
| 2022 | $11,934 | $170,717 | $44,017 | $126,700 |
| 2021 | $11,406 | $162,588 | $41,921 | $120,667 |
| 2020 | $11,189 | $160,012 | $41,257 | $118,755 |
| 2019 | $10,997 | $155,502 | $40,094 | $115,408 |
| 2018 | $10,978 | $152,547 | $39,212 | $113,335 |
| 2017 | $10,810 | $148,609 | $38,200 | $110,409 |
| 2016 | $10,790 | $145,410 | $37,378 | $108,032 |
| 2015 | $10,850 | $139,817 | $35,940 | $103,877 |
| 2014 | $10,850 | $135,740 | $35,940 | $99,800 |
| 2013 | $10,850 | $135,740 | $35,940 | $99,800 |
Source: Public Records
Map
Nearby Homes
- 26106 W Sherwood Cir
- 23234 W Allagash Dr
- 24024 W Champion Dr
- 2547 Mallet Ct
- 2543 Mallet Ct
- 2539 Mallet Ct
- 2611 Lawlor Ln
- 2607 Lawlor Ln
- 2519 Mallet Ct
- 2515 Mallet Ct
- 2419 Lawlor Ln
- 2423 Lawlor Ln
- 2427 Lawlor Ln
- 2668 Lawlor Ln
- 2547 Tailshot Rd
- 5907 Polo St
- 5919 Polo St
- 2711 Lawlor Ln
- 2739 Lawlor Ln
- 2711 Wait Rd
- 5319 Bundle Flower Ct
- 5316 Prairie Sage Rd
- 5316 Prairie Sage Ln
- 5307 Bundle Flower Ct
- 5320 Prairie Sage Rd
- 5312 Prairie Sage Ln
- 5312 Prairie Sage Rd
- 5320 Prairie Sage Ln
- 5323 Bundle Flower Ct
- 5324 Prairie Sage Rd
- 5316 Bundle Flower Ct
- 5308 Prairie Sage Rd
- 5324 Prairie Sage Ln
- 5312 Bundle Flower Ct
- 5320 Bundle Flower Ct
- 5303 Bundle Flower Ct
- 5308 Bundle Flower Ct
- 5328 Prairie Sage Rd
- 5327 Bundle Flower Ct
- 5304 Prairie Sage Rd