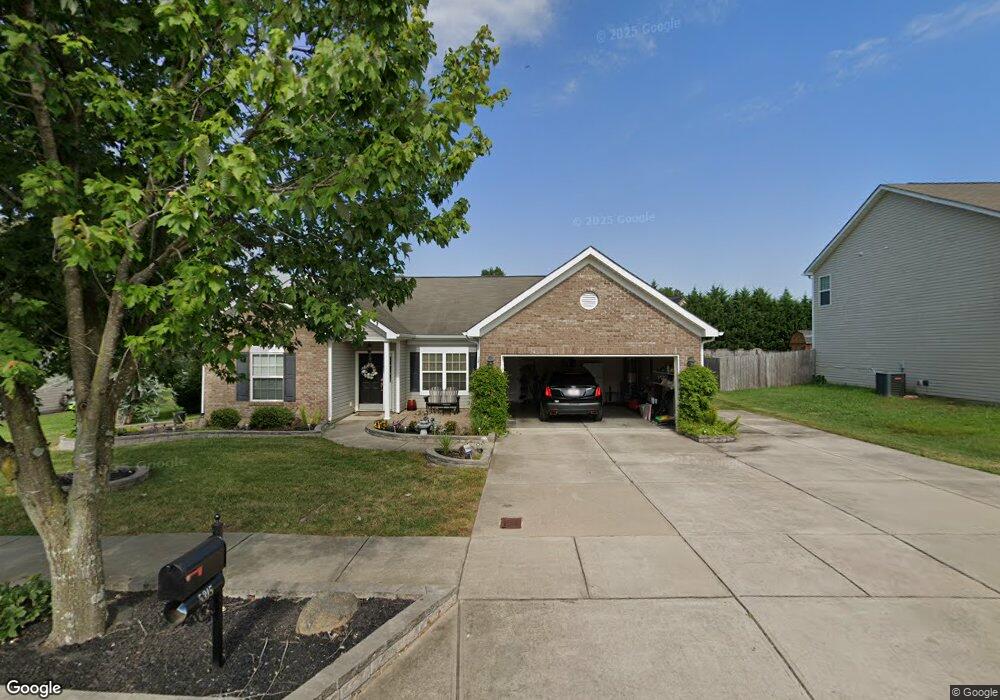
5315 Hackberry Ln SW Unit 46 Concord, NC 28027
Estimated Value: $438,000 - $458,000
3
Beds
2
Baths
1,886
Sq Ft
$236/Sq Ft
Est. Value
About This Home
This home is located at 5315 Hackberry Ln SW Unit 46, Concord, NC 28027 and is currently estimated at $444,157, approximately $235 per square foot. 5315 Hackberry Ln SW Unit 46 is a home located in Cabarrus County with nearby schools including Pitts School Road Elementary School, Roberta Road Middle School, and Jay M. Robinson High School.
Ownership History
Date
Name
Owned For
Owner Type
Purchase Details
Closed on
Feb 16, 2021
Sold by
Reid Gary W and Reid Judy
Bought by
Reid Gary W and Reid Judy
Current Estimated Value
Home Financials for this Owner
Home Financials are based on the most recent Mortgage that was taken out on this home.
Original Mortgage
$202,000
Outstanding Balance
$180,667
Interest Rate
2.7%
Mortgage Type
VA
Estimated Equity
$263,490
Purchase Details
Closed on
Oct 28, 2014
Sold by
Zito Barbara and Mooney Richard
Bought by
Reid Gary W and Reid Judy
Home Financials for this Owner
Home Financials are based on the most recent Mortgage that was taken out on this home.
Original Mortgage
$154,400
Interest Rate
4.15%
Mortgage Type
New Conventional
Purchase Details
Closed on
Feb 20, 2012
Sold by
Mooney Richard and Zito Barbara
Bought by
Zito Barbara
Purchase Details
Closed on
Jan 20, 2012
Sold by
Timberstone Homes Inc
Bought by
Mooney Richard and Zito Barbara
Create a Home Valuation Report for This Property
The Home Valuation Report is an in-depth analysis detailing your home's value as well as a comparison with similar homes in the area
Home Values in the Area
Average Home Value in this Area
Purchase History
| Date | Buyer | Sale Price | Title Company |
|---|---|---|---|
| Reid Gary W | -- | None Available | |
| Reid Gary W | -- | None Listed On Document | |
| Reid Gary W | $193,000 | None Available | |
| Zito Barbara | -- | None Available | |
| Mooney Richard | $159,000 | None Available |
Source: Public Records
Mortgage History
| Date | Status | Borrower | Loan Amount |
|---|---|---|---|
| Open | Reid Gary W | $202,000 | |
| Closed | Reid Gary W | $202,000 | |
| Previous Owner | Reid Gary W | $154,400 |
Source: Public Records
Tax History Compared to Growth
Tax History
| Year | Tax Paid | Tax Assessment Tax Assessment Total Assessment is a certain percentage of the fair market value that is determined by local assessors to be the total taxable value of land and additions on the property. | Land | Improvement |
|---|---|---|---|---|
| 2025 | $3,752 | $421,710 | $120,000 | $301,710 |
| 2024 | $3,752 | $421,710 | $120,000 | $301,710 |
| 2023 | $2,264 | $230,600 | $55,000 | $175,600 |
| 2022 | $2,264 | $230,600 | $55,000 | $175,600 |
| 2021 | $2,264 | $230,600 | $55,000 | $175,600 |
| 2020 | $2,120 | $218,730 | $55,000 | $163,730 |
| 2019 | $1,736 | $187,260 | $30,000 | $157,260 |
| 2018 | $1,624 | $180,310 | $30,000 | $150,310 |
| 2017 | $1,597 | $180,310 | $30,000 | $150,310 |
| 2016 | $947 | $160,600 | $32,000 | $128,600 |
| 2015 | $1,895 | $160,600 | $32,000 | $128,600 |
| 2014 | $1,895 | $160,600 | $32,000 | $128,600 |
Source: Public Records
Map
Nearby Homes
- 4266 Barley St SW
- 4271 Millet St SW Unit 198
- 842 Treva Anne Dr SW
- 849 Treva Anne Dr SW
- 5361 Brickyard Terrace Ct
- 3907 Melissa Dr
- 706 King Fredrick Ln SW
- 3254 Hawick Commons Dr
- 4114 Carolina Pointe Ct SW
- 5899 Crimson Oak Ct
- 4333 Glen Eagles Ln SW
- 4112 Alexis Ct SW
- 4349 Roberta Rd
- 3950 Harrisburg Dr
- 3642 Waterloo Dr
- 3648 Waterloo Dr
- 3618 Waterloo Dr
- 6050 Roberta Rd
- 5366 Hardister Place
- 6106 Cambridge Dr
- 5315 Hackberry Ln SW
- 5319 Hackberry Ln SW
- 5311 Hackberry Ln SW
- 5323 Hackberry Ln SW
- 5318 Hackberry Ln SW
- 5310 Hackberry Ln SW
- 5314 Hackberry Ln SW
- 4889 Keeneland Place SW
- 4889 Keeneland Place SW Unit 15
- 5322 Hackberry Ln SW
- 4893 Keeneland Place SW
- 4885 Keeneland Place SW
- 5327 Hackberry Ln SW Unit 43
- 5327 Hackberry Ln SW
- 4881 Keeneland Place SW
- 5306 Hackberry Ln SW
- 5303 Hackberry Ln SW
- 5303 Hackberry Ln SW Unit 49
- 4897 Keeneland Place SW
- 5326 Hackberry Ln SW