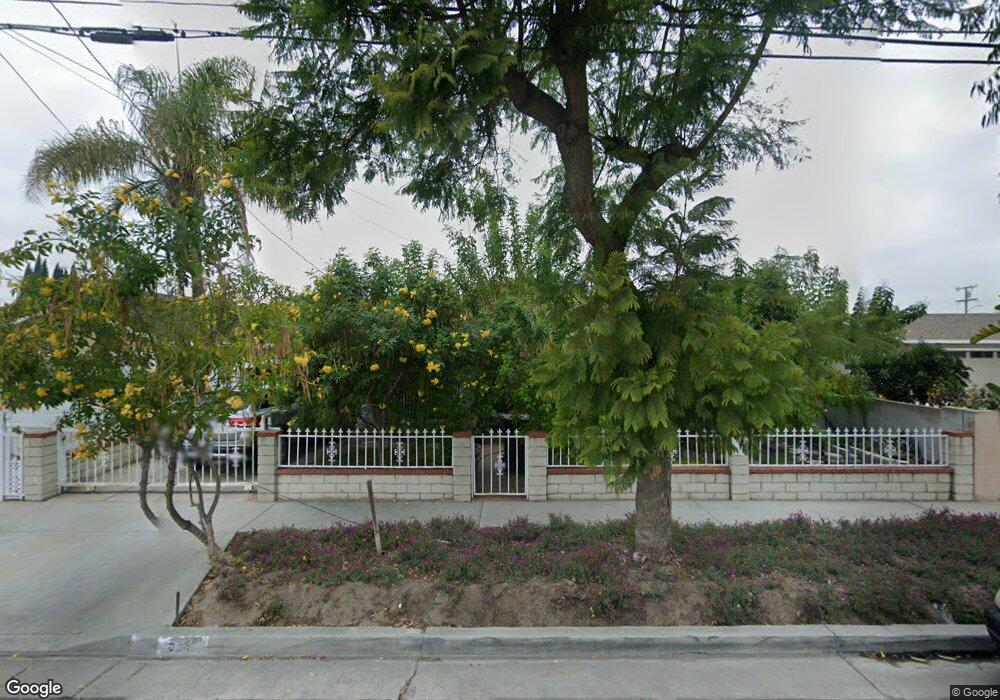
5317 W 5th St Santa Ana, CA 92703
Little Saigon NeighborhoodEstimated Value: $759,000 - $921,000
3
Beds
1
Bath
1,071
Sq Ft
$775/Sq Ft
Est. Value
About This Home
This home is located at 5317 W 5th St, Santa Ana, CA 92703 and is currently estimated at $830,463, approximately $775 per square foot. 5317 W 5th St is a home located in Orange County with nearby schools including Post Elementary, James Irvine Intermediate School, and La Quinta High School.
Ownership History
Date
Name
Owned For
Owner Type
Purchase Details
Closed on
Sep 3, 1997
Sold by
Cao Thanh X and Tran Mylinh
Bought by
Pho Long Duc
Current Estimated Value
Home Financials for this Owner
Home Financials are based on the most recent Mortgage that was taken out on this home.
Original Mortgage
$91,200
Outstanding Balance
$14,071
Interest Rate
7.42%
Estimated Equity
$816,392
Purchase Details
Closed on
Mar 22, 1997
Sold by
Hud
Bought by
Cao Thanh X and Tran Mylinh
Purchase Details
Closed on
Jul 1, 1996
Sold by
Homeside Lending Inc
Bought by
Hud
Purchase Details
Closed on
May 3, 1996
Sold by
Alonzo Hector R and Alonzo Sonia E
Bought by
Bancboston Mtg Corp
Purchase Details
Closed on
Sep 29, 1995
Sold by
New England Financial Corp
Bought by
Alonzo Hector R and Alonzo Sonia E
Purchase Details
Closed on
Jun 21, 1995
Sold by
Alonzo Hector R and Alonzo Sonia E
Bought by
New England Financial Corp
Create a Home Valuation Report for This Property
The Home Valuation Report is an in-depth analysis detailing your home's value as well as a comparison with similar homes in the area
Home Values in the Area
Average Home Value in this Area
Purchase History
| Date | Buyer | Sale Price | Title Company |
|---|---|---|---|
| Pho Long Duc | $114,000 | Landwood Title Company | |
| Pho Long Duc | -- | Landwood Title Company | |
| Cao Thanh X | $84,500 | Lawyers Title Company | |
| Hud | -- | First Southwestern Title Co | |
| Bancboston Mtg Corp | $137,351 | First Southwestern Title Co | |
| Alonzo Hector R | -- | -- | |
| New England Financial Corp | -- | -- |
Source: Public Records
Mortgage History
| Date | Status | Borrower | Loan Amount |
|---|---|---|---|
| Open | Pho Long Duc | $91,200 |
Source: Public Records
Tax History Compared to Growth
Tax History
| Year | Tax Paid | Tax Assessment Tax Assessment Total Assessment is a certain percentage of the fair market value that is determined by local assessors to be the total taxable value of land and additions on the property. | Land | Improvement |
|---|---|---|---|---|
| 2025 | $2,270 | $182,017 | $143,094 | $38,923 |
| 2024 | $2,270 | $178,449 | $140,289 | $38,160 |
| 2023 | $2,222 | $174,950 | $137,538 | $37,412 |
| 2022 | $2,171 | $171,520 | $134,841 | $36,679 |
| 2021 | $2,147 | $168,157 | $132,197 | $35,960 |
| 2020 | $2,118 | $166,433 | $130,841 | $35,592 |
| 2019 | $2,080 | $163,170 | $128,275 | $34,895 |
| 2018 | $2,039 | $159,971 | $125,760 | $34,211 |
| 2017 | $2,010 | $156,835 | $123,294 | $33,541 |
| 2016 | $1,928 | $153,760 | $120,876 | $32,884 |
| 2015 | $1,899 | $151,451 | $119,060 | $32,391 |
| 2014 | $1,852 | $148,485 | $116,728 | $31,757 |
Source: Public Records
Map
Nearby Homes
- 5317 Silver Dr
- 5405 W 4th St
- 323 N Euclid St Unit 99
- 10886 Lotus Dr
- 4832 W 5th St Unit B
- 5112 W 1st St Unit C
- 5132 W 1st St Unit B
- 5114 W 1st St Unit C
- 14376 Euclid St Unit 1-4
- 13322 Euclid St
- 14356 Taft St
- 10632 Henderson Ave
- 4518 W 1st St
- 14151 Lake St
- 615 S Euclid St
- 10562 Davit Ave
- 4248 W 5th St
- 4201 W 5th St Unit 314
- 1609 N Parsons Place
- 4512 W Watkins Way