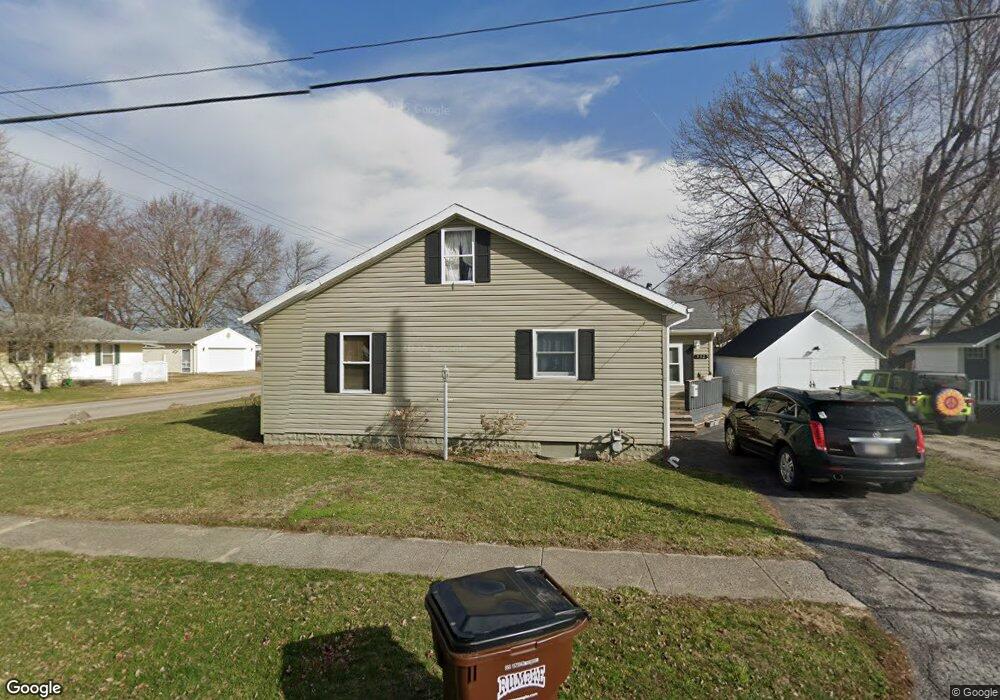
532 Swing Ave Findlay, OH 45840
Estimated Value: $169,484 - $227,000
4
Beds
2
Baths
1,594
Sq Ft
$120/Sq Ft
Est. Value
About This Home
This home is located at 532 Swing Ave, Findlay, OH 45840 and is currently estimated at $190,621, approximately $119 per square foot. 532 Swing Ave is a home located in Hancock County with nearby schools including Northview Elementary School, Bigelow Hill Elementary School, and Glenwood Middle School.
Ownership History
Date
Name
Owned For
Owner Type
Purchase Details
Closed on
Apr 29, 2019
Sold by
Baney John A
Bought by
Brown Marcus and Brown Emily
Current Estimated Value
Home Financials for this Owner
Home Financials are based on the most recent Mortgage that was taken out on this home.
Original Mortgage
$144,337
Outstanding Balance
$129,448
Interest Rate
5.25%
Mortgage Type
FHA
Estimated Equity
$61,173
Purchase Details
Closed on
May 9, 2016
Sold by
Wilson Ronald L and Wilson Amy J
Bought by
Baney John A
Home Financials for this Owner
Home Financials are based on the most recent Mortgage that was taken out on this home.
Original Mortgage
$120,772
Interest Rate
3.5%
Mortgage Type
FHA
Purchase Details
Closed on
Feb 2, 1987
Bought by
Wilson Ronald L and Wilson Amy J
Purchase Details
Closed on
Sep 23, 1983
Bought by
Christman Mark E
Purchase Details
Closed on
May 3, 1983
Bought by
Sec Of Housing & Urban Dev
Purchase Details
Closed on
May 21, 1981
Bought by
Kline David Lee and Kline Connie A
Create a Home Valuation Report for This Property
The Home Valuation Report is an in-depth analysis detailing your home's value as well as a comparison with similar homes in the area
Home Values in the Area
Average Home Value in this Area
Purchase History
| Date | Buyer | Sale Price | Title Company |
|---|---|---|---|
| Brown Marcus | $147,000 | Golden Key Title | |
| Baney John A | $123,000 | Whitman Title | |
| Wilson Ronald L | $25,000 | -- | |
| Christman Mark E | -- | -- | |
| Sec Of Housing & Urban Dev | -- | -- | |
| Kline David Lee | -- | -- |
Source: Public Records
Mortgage History
| Date | Status | Borrower | Loan Amount |
|---|---|---|---|
| Open | Brown Marcus | $144,337 | |
| Closed | Baney John A | $120,772 |
Source: Public Records
Tax History Compared to Growth
Tax History
| Year | Tax Paid | Tax Assessment Tax Assessment Total Assessment is a certain percentage of the fair market value that is determined by local assessors to be the total taxable value of land and additions on the property. | Land | Improvement |
|---|---|---|---|---|
| 2024 | $1,583 | $44,550 | $6,500 | $38,050 |
| 2023 | $1,585 | $44,550 | $6,500 | $38,050 |
| 2022 | $1,579 | $44,550 | $6,500 | $38,050 |
| 2021 | $1,417 | $34,820 | $6,490 | $28,330 |
| 2020 | $1,417 | $34,820 | $6,490 | $28,330 |
| 2019 | $1,388 | $34,820 | $6,490 | $28,330 |
| 2018 | $1,332 | $30,650 | $5,650 | $25,000 |
| 2017 | $666 | $30,650 | $5,650 | $25,000 |
| 2016 | $1,321 | $30,650 | $5,650 | $25,000 |
| 2015 | $1,211 | $27,700 | $5,650 | $22,050 |
| 2014 | $1,211 | $27,700 | $5,650 | $22,050 |
| 2012 | $1,220 | $27,700 | $5,650 | $22,050 |
Source: Public Records
Map
Nearby Homes
- 604 Davis St
- 533 Davis St
- 410 Monroe Ave
- 1005 Broad Ave
- 405 Clifton Ave
- 524 Defiance Ave
- 304 Rector Ave
- 304 Prentiss Ave
- 643 Edith Ave
- 115 George St
- 1820 N Main St
- 1934 Geffs Ave
- 706 N Cory St
- 206 Midland Ave
- 224 Defiance Ave
- 905 W Melrose Ave
- 925 W Melrose Ave
- 230 Midland Ave
- 1825 Pershing St
- 512 N Cory St
- 530 Swing Ave
- 600 Swing Ave
- 526 Swing Ave
- 604 Swing Ave
- 533 W Foulke Ave
- 1231 Bolton St
- 531 W Foulke Ave
- 608 Swing Ave
- 520 Swing Ave
- 601 W Foulke Ave
- 601 Swing Ave
- 525 Swing Ave
- 533 Swing Ave
- 609 W Foulke Ave
- 521 W Foulke Ave
- 529 Swing Ave
- 518 Swing Ave
- 1229 Bolton St
- 616 Swing Ave
- 1227-1229 Bolton St